Python for Data Science: Chapter 4: Descriptive Analytics
Normal Distributions and Standard (z) Scores
Normal Distributions and Standard (z) Scores: Definition, Characteristics, Normal distribution formula, Applications of normal distribution, Formula, Example Problems
Normal
Distributions and Standard (z) Scores
•
Many real‒world phenomena like heights,
weights, exam marks or daily temperatures tend to cluster around an average
value. This pattern is called as normal
distribution.
• Definition: A normal
distribution is a symmetrical, bell‒shaped
curve that shows how data values are distributed around the mean(average).
•
The normal distribution is a continuous
probability distribution. It is symmetric and bell shaped. It is also called as
Gaussian distribution.
•
It describes how data is distributed around
a center value or a mean value.
Characteristics
1) Symmetry: The
distribution is perfectly symmetrical around the mean (average). The left and
right sides of the curve are mirror images.
2) Mean, median and mode:
In this distribution method, the Mean = Median = Mode.
3) Bell shaped curve: The graph of a
normal distribution is a smooth, symmetric bell‒ shaped curve. The highest point
of the curve is at the mean (μ). The total area under the Gaussian distribution
curve equals 1. The normal distributions curve is unimodal (has one peak). The
curve approaches the x‒axis but does not touch it.
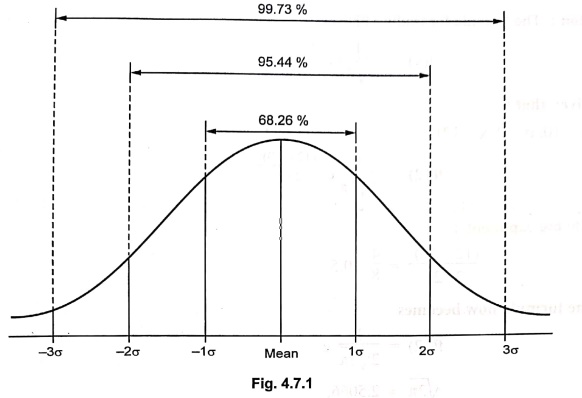
4) Standard deviation :
•
The spread or width of the distribution is determined by the standard deviation.
•
About 68 % of the data falls within one standard deviation of the mean.
•
About 95% of the data falls within two standard deviations of the mean.
•
About 99.7% of the data falls within three standard deviations of the mean.
•
This is called Empirical rule.
Normal distribution formula
Mathematically
the Probability Density Function (PDF) of normal distribution is
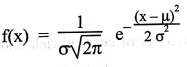
where:
x
= Value in the dataset
μ
= Mean (average)
σ
= Standard deviation (Spread of data)
e
= Euler's number (≈ 2.718)
Example:1
A random
variable X follows a normal distribution with mean of 10 and a standard
deviation of 2. Find the value of the Probability Density Function (PDF) at x =
12.
Solution:
The formula for finding PDF is
Given that:
(μ
= 10, σ = 2, x = 12):
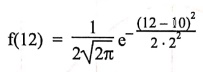
Simplify the exponent:
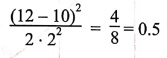
[(12‒10)2
] / 2.22 = 4/8 =
0.5
The formula now becomes
f(12)
= [ 1 / 2√2π ] e ‒0.5
√2π ≈ 2.5066,
e‒0.5
≈
0.6065.
f(12)
= [1 / 2×2.5066 ] . 0.6065
=
0.6065 / 5.0132 ≈ 0.1210
Hence,
the value of the PDF at x = 12 is approximately 0.1210
Applications of normal distribution
1.
Normal distribution is used in monitoring product dimensions or performance to
ensure they meet specifications.
2.It
is used for modeling stock returns, asset prices and risk analysis.
3.Normal
distribution is used in analyzing heights, weights and other biological measurements.
4.
Normal distribution is used for studying test scores, IQ and survey data.
Standard z‒score
•
Sometimes we want to know how far a particular value is from the mean in terms
of standard deviation.
• Definition of z‒score:
The z‒score (or standard score) tells how many standard deviations a data point
is above or below the mean.
Formula:
z =
(X
‒μ) / σ
where
X
= Individual value
μ
= Mean
σ
= Standard deviation
Example:2
Consider
Mean = 70, Standard deviation = 10, and student's score is 85. Calculate Z
score and interpret your answer.
Solution :
The
z score can be calculated as
z =
(X
‒μ) / σ = (85‒70) / 10
z
= 1.5
Interpretation:
The student scored is standard deviation above mean. That means this student
has scored better than most of the students.
Example:3
Consider
mean height = 165 cm, σ = 5 cm, X = 155 cm. Calculate z score and interpreter
your result.
Solution :
z = (155‒165) / 5
= ‒2
Interpretation:
The height is 2 standard deviations below mean. So the height of student is
short as compared to average.
Review Question
1. Why is the normal distribution called "bell‒shaped"
?
Python for Data Science: Chapter 4: Descriptive Analytics : Tag: Computer Programming, Python, Data Science : - Normal Distributions and Standard (z) Scores
Python for Data Science: Chapter 4: Descriptive Analytics
Under Subject

Python for Data Science
AD25201 2nd Semester AIDS Dept | 2025 Regulation | 2nd Semester 2025 Regulation
Related Subjects

English Essentials II
EN25C02 2nd Semester | 2025 Regulation | 2nd Semester 2025 Regulation

Tamils and Technology தமிழர்களும் தொழில்நுட்பமும்
UC25H02 2nd Semester | 2025 Regulation | 2nd Semester 2025 Regulation

Linear Algebra
MA25C02 2nd Semester | 2025 Regulation

Applied Physics (CSIE) II
PH25C03 2nd Semester AIDS, CSE, IT, CSE(CY) Dept | 2025 Regulation | 2nd Semester 2025 Regulation

Digital Principles and Computer Organization
CS25C06 2nd Semester AIDS, CSE, IT, CSE(CY) Dept | 2025 Regulation | 2nd Semester 2025 Regulation

Basic Electrical and Electronics Engineering
EE25C01 2nd Semester | 2025 Regulation | 2nd Semester 2025 Regulation
Python for Data Science
AD25201 2nd Semester AIDS Dept | 2025 Regulation | 2nd Semester 2025 Regulation

Re-Engineering for Innovation
ME25C05 2nd Semester | 2025 Regulation | 2nd Semester 2025 Regulation

Python for Data Science - Laboratory
AD25201 2nd Semester AIDS Dept | 2025 Regulation | 2nd Semester 2025 Regulation