Python for Data Science: Chapter 4: Descriptive Analytics
Describing Variability
Descriptive Analytics
For describing variability there are three measures 1) Range 2) Variance 3) Standard deviation. Significance of descriptive statistics in Real‒world applications
Describing
Variability
Variability
refers to how much the data values differ from each other. All data are not
same. We need to know how much they vary from the center. For describing variability
there are three measures ‒
1)
Range
2)
Variance
3)
Standard deviation
1) Range:
It is the difference between largest and smallest values or difference between
max and min value. For example ‒
Consider
10, 20, 30, 40, 50 are the data points then range = max‒min = 50 ‒10 = 40
2) Variance:
It represents how far each value is from the mean. The formula is ‒
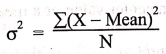
For
example ‒ If data is 5, 10, 15 mean = 10
Variance
= [(5 − 10)2 + (10 − 10)2+(15
– 10)2 ] / 3
=
[25+0+25] / 3
=
16.67
3) Standard deviation:
It is square root of variance. The formula used is ‒
σ
= √ Variance
If
variance is 16.67 then standard deviation is = √16.67=4.08
If
SD is small then data values are close together.
If
SD is large then data values are spread out.
Significance of descriptive statistics in Real‒world applications
1) Mean ‒
Used in economics, finance and science to calculate average values, such as
average income, stock prices or test scores.
2) Median ‒
Useful in real estate and income distribution to find the middle value,
avoiding skewness from extreme values.
3) Mode ‒
Applied in marketing and inventory management to determine the most common
product size, color or preference.
4) Range ‒
Helps in weather forecasting and sports analytics to understand data
variability, such as temperature differences or score variations.
5) Variance ‒
Used in risk assessment and finance to measure the dispersion of returns in
investments.
6) Standard deviation ‒ Applied
in quality control and stock market analysis to determine consistency and volatility.
Python for Data Science: Chapter 4: Descriptive Analytics : Tag: Computer Programming, Python, Data Science : Descriptive Analytics - Describing Variability
Python for Data Science: Chapter 4: Descriptive Analytics
Under Subject

Python for Data Science
AD25201 2nd Semester AIDS Dept | 2025 Regulation | 2nd Semester 2025 Regulation
Related Subjects

English Essentials II
EN25C02 2nd Semester | 2025 Regulation | 2nd Semester 2025 Regulation

Tamils and Technology தமிழர்களும் தொழில்நுட்பமும்
UC25H02 2nd Semester | 2025 Regulation | 2nd Semester 2025 Regulation

Linear Algebra
MA25C02 2nd Semester | 2025 Regulation

Applied Physics (CSIE) II
PH25C03 2nd Semester AIDS, CSE, IT, CSE(CY) Dept | 2025 Regulation | 2nd Semester 2025 Regulation

Digital Principles and Computer Organization
CS25C06 2nd Semester AIDS, CSE, IT, CSE(CY) Dept | 2025 Regulation | 2nd Semester 2025 Regulation

Basic Electrical and Electronics Engineering
EE25C01 2nd Semester | 2025 Regulation | 2nd Semester 2025 Regulation
Python for Data Science
AD25201 2nd Semester AIDS Dept | 2025 Regulation | 2nd Semester 2025 Regulation

Re-Engineering for Innovation
ME25C05 2nd Semester | 2025 Regulation | 2nd Semester 2025 Regulation

Python for Data Science - Laboratory
AD25201 2nd Semester AIDS Dept | 2025 Regulation | 2nd Semester 2025 Regulation