Python for Data Science: Chapter 4: Descriptive Analytics
Correlation and Scatter Plot
Descriptive Analytics
Correlation analysis is a kind of analysis in which the relationship between two variables is identified. In other words, it determines the strength of a link between two variables.
Correlation
and Scatter Plot
•
Correlation analysis is a kind of analysis in which the relationship between
two variables is identified. In other words, it determines the strength of a
link between two variables.
•
For
example ‒ Height and weight of a person are correlated. That means
normally, the height of a person increases his / her weight also increases.
Another example is, ‒ if person spends more hours on exercising, his/her weight
gets decreases.
•
Correlation analysis is done to detect patterns and trends in data and to
forecast future Occurrences.
Types of correlation
•
There are three types of correlations ‒
1)
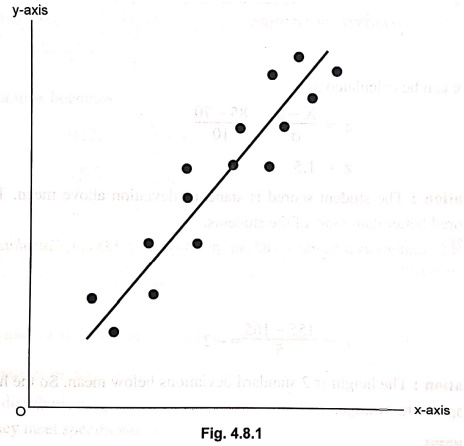
Positive correlation: This is a type of correlation in
which when one variable increases another variable also increases. It indicates
direct relationship.
For
example ‒ There is a positive correlation between ice‒cream sales and
temperature. That means that on hotter days, people are more likely to buy ice‒cream.
Another example is the amount of time students spent studying and their exam
scores. That means if you study more, better score can be secured.
2)
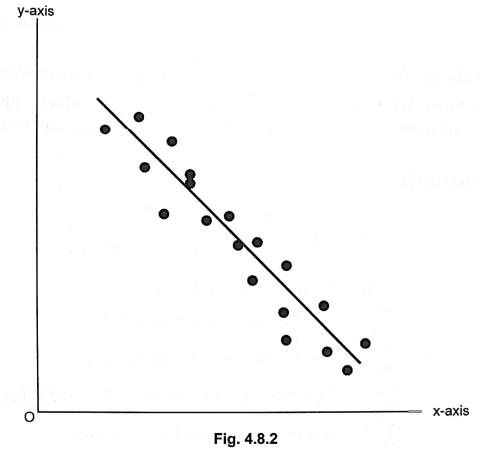
Negative correlation: A negative correlation is just the
opposite. This is a type of correlation in which when one variable increases
another variable decreases. This relationship line has negative slope. For
example ‒ As the temperature decreases, the sale of winter coats increases.
Another example ‒ As you spent more money, the bank aids balance decreases.
3) No correlation
or Zero correlation :
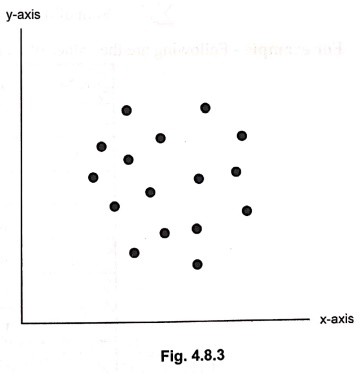
No correlation simply means that the variables behave very differently and
thus, have no linear relationship. For example The size of a shoe and the color
of shirt which I am wearing has no correlation.
A
positive correlation indicates that the two variables move in the same direction,
while a negative correlation indicates that the two variables move in opposite
directions.
Python for Data Science: Chapter 4: Descriptive Analytics : Tag: Computer Programming, Python, Data Science : Descriptive Analytics - Correlation and Scatter Plot
Python for Data Science: Chapter 4: Descriptive Analytics
Under Subject

Python for Data Science
AD25201 2nd Semester AIDS Dept | 2025 Regulation | 2nd Semester 2025 Regulation
Related Subjects

English Essentials II
EN25C02 2nd Semester | 2025 Regulation | 2nd Semester 2025 Regulation

Tamils and Technology தமிழர்களும் தொழில்நுட்பமும்
UC25H02 2nd Semester | 2025 Regulation | 2nd Semester 2025 Regulation

Linear Algebra
MA25C02 2nd Semester | 2025 Regulation

Applied Physics (CSIE) II
PH25C03 2nd Semester AIDS, CSE, IT, CSE(CY) Dept | 2025 Regulation | 2nd Semester 2025 Regulation

Digital Principles and Computer Organization
CS25C06 2nd Semester AIDS, CSE, IT, CSE(CY) Dept | 2025 Regulation | 2nd Semester 2025 Regulation

Basic Electrical and Electronics Engineering
EE25C01 2nd Semester | 2025 Regulation | 2nd Semester 2025 Regulation
Python for Data Science
AD25201 2nd Semester AIDS Dept | 2025 Regulation | 2nd Semester 2025 Regulation

Re-Engineering for Innovation
ME25C05 2nd Semester | 2025 Regulation | 2nd Semester 2025 Regulation

Python for Data Science - Laboratory
AD25201 2nd Semester AIDS Dept | 2025 Regulation | 2nd Semester 2025 Regulation