Python for Data Science: Chapter 5: NumPy and Pandas Libraries
Pandas: Groups
Python library
Question: In Pandas, explain the functions that are used for making groups
Groups
•
We can group the data items in the data
set and get locations of these data items in the data set by using the groups function. Following code returns
the indices of each country in the data set.
import pandas as pd
spending =
pd.DataFrame({'Year': [ 1970, 1970, 1970, 1970, 1970, 1971,
1971, 1971, 1971, 1971, 1972, 1972, 1972],
'Country':
['Germany','France', 'Great_Britain', 'Japan', 'USA', 'Canada',
'Germany','Great_Britain','Japan', 'USA',
'Germany','Japan','USA'],
'Spending_USD':
[252,192,123,150,326,313,298,134,163,357,337,185,397],
'Life Expectancy': [70,72,71,72,71,73,70,72,73,71,71,74,71]},
columns=['Year','Country','Spending_USD','Life_Expectancy'])
print(spendings.groupby(['Country']).groups)
Output
{'Canada': [5],
'France': [1], 'Germany': [0, 6, 10], 'Great_Britain': [2, 7], 'Japan': [3, 8,
11], 'USA': [4, 9, 12]}
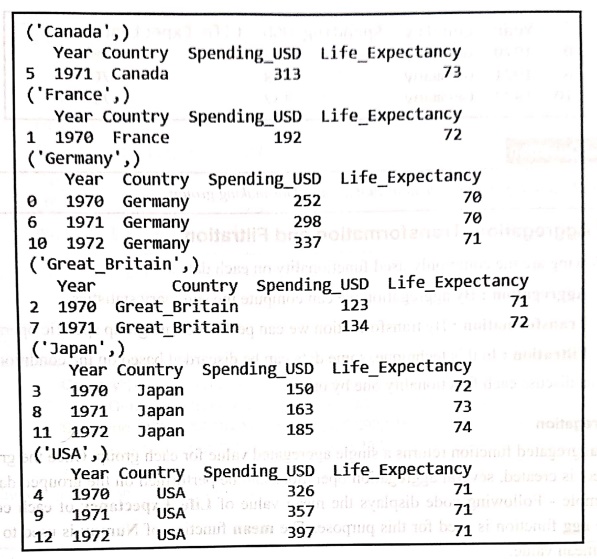
Iterating through each group
•
We can iterate through each group and display the record. Following code
illustrates it
import pandas as pd
pd.DataFrame({'Year':[1970,1970, 1970, 1970, 1970, 1971, 1971,
1971, 1971, 1971, 1972, 1972, 1972],
'Country': ['Germany', 'France', 'Great_Britain', 'Japan',
'USA', 'Canada',
'Germany', 'Great Britain', 'Japan', 'USA', 'Germany', 'Japan',
'USA'],
'Spending USD':
[252,192,123,150,326,313,298,134,163,357,337,185,397],
'Life Expectancy': [70,72,71,72,71,73,70,72,73,71,71,74,71]},
columns = ['Year','Country','Spending_USD', 'Life Expectancy'])
mygroup = spendings.groupby(['Country'])
for name,group in mygroup:
print(name)
print(group)
Output
Getting particular group
•
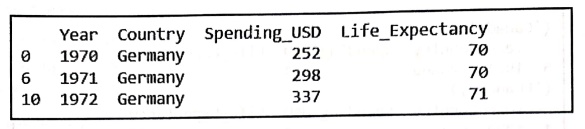
Using get_group function we can
select particular group from the data set and display the information of that
group. Following code illustrates it
import pandas as pd
spending =
pd.DataFrame({'Year':[1970,1970, 1970, 1970, 1970, 1971, 1971,
1971, 1971, 1971, 1972, 1972, 1972],
'Country': ['Germany', France','Great Britain', 'Japan', 'USA','Canada',
'Germany','Great_Britain', 'Japan','USA','Germany', 'Japan',
'USA'],
'Spending_USD':
[252,192,123,150,326,313,298,134,163,357,337,185,397).
'Life Expectancy': [70,72,71,72,71,73,70,72,73,71,71,74,71]},
columns = ['Year','Country','Spending_USD', 'Life_Expectancy'])
mygroup = spendings.groupby(['Country'])
print(mygroup.get_group('Germany'))
Output
Review Question
1. In Pandas, explain
the functions that are used for making groups
Python for Data Science: Chapter 5: NumPy and Pandas Libraries : Tag: Computer Programming, Python, Data Science : Python library - Pandas: Groups
Python for Data Science: Chapter 5: NumPy and Pandas Libraries
Under Subject

Python for Data Science
AD25201 2nd Semester AIDS Dept | 2025 Regulation | 2nd Semester 2025 Regulation
Related Subjects

English Essentials II
EN25C02 2nd Semester | 2025 Regulation | 2nd Semester 2025 Regulation

Tamils and Technology தமிழர்களும் தொழில்நுட்பமும்
UC25H02 2nd Semester | 2025 Regulation | 2nd Semester 2025 Regulation

Linear Algebra
MA25C02 2nd Semester | 2025 Regulation

Applied Physics (CSIE) II
PH25C03 2nd Semester AIDS, CSE, IT, CSE(CY) Dept | 2025 Regulation | 2nd Semester 2025 Regulation

Digital Principles and Computer Organization
CS25C06 2nd Semester AIDS, CSE, IT, CSE(CY) Dept | 2025 Regulation | 2nd Semester 2025 Regulation

Basic Electrical and Electronics Engineering
EE25C01 2nd Semester | 2025 Regulation | 2nd Semester 2025 Regulation
Python for Data Science
AD25201 2nd Semester AIDS Dept | 2025 Regulation | 2nd Semester 2025 Regulation

Re-Engineering for Innovation
ME25C05 2nd Semester | 2025 Regulation | 2nd Semester 2025 Regulation

Python for Data Science - Laboratory
AD25201 2nd Semester AIDS Dept | 2025 Regulation | 2nd Semester 2025 Regulation