Python for Data Science: Chapter 5: NumPy and Pandas Libraries
Pandas: Aggregation, Transformation and Filtration
Python library
Questions: 1.What is data aggregation? Explain different types of aggregation functions. 2. Explain GroupBy object with suitable example. 3. Explain aggregation, transformation and filtration techniques in detail.
Aggregation,
Transformation and Filtration
•
Following are the commonly used
functionality on each data set ‒
1) Aggregation:
By aggregation we can compute the summary statistics.
2) Transformation:
By transformation we can perform some group specific operation.
3) Filtration: In
this technique, some data can be discarded based on the condition.
•
Let us discuss each functionality one by one
1) Aggregation
• An
aggregated function returns a single aggregated value for each group. Once the
group by Its object is created, several aggregation operations can be performed
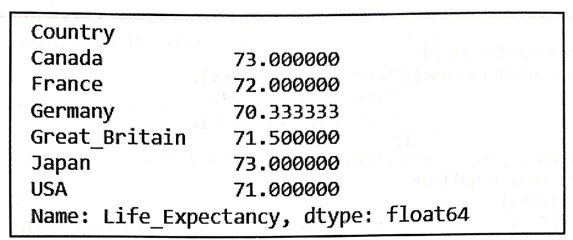
on the grouped data. For example ‒ Following code displays the mean value of Life Expectancy of each country. inThe agg function is used for this purpose.
The mean function of Numpy is used to obtain the mean value.
import pandas as pd
import numpy as np
spending =
pd.DataFrame({'Year':[1970, 1970, 1970, 1970, 1970, 1971, 1971,
1971, 1971, 1971, 1972, 1972, 1972],
'Country': ['Germany', 'France','Great Britain', 'Japan','USA',
'Canada,
'Germany','Great_Britain', 'Japan', 'USA','Germany', 'Japan',
'USA'],
Spending USD':
[252,192,123,150,326,313,298,134,163,357,337,185,397],
'Life Expectancy': [70,72,71,72,71,73,70,72,73,71,71,74,71]},
columns = ['Year', 'Country','Spending USD','Life Expectancy'])
mygroup = spendings.groupby(['Country'])
print(mygroup['Life Expectancy'].agg(np.mean))
Output
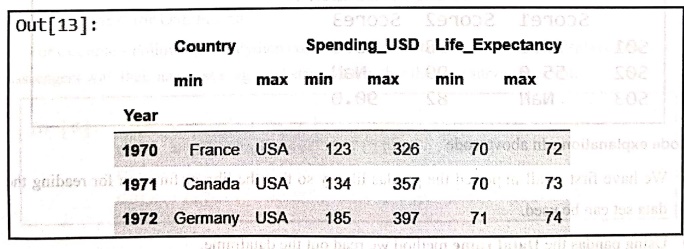
• We can apply multiple functions at a time,
the code is as follows ‒
import pandas as pd
import numpy as np
spending =
pd.DataFrame({'Year':[1970, 1970, 1970, 1970, 1970, 1971, 1971,
1971, 1971, 1971, 1972, 1972, 1972],
'Country': ['Germany', 'France', 'Great Britain', 'Japan',
'USA', 'Canada',
'Germany', 'Great_Britain', 'Japan', 'USA', 'Germany', 'Japan',
'USA'],
'Spending_USD':
[252,192,123,150,326,313,298,134,163,357,337,185,397],
'Life Expectancy': [70,72,71,72,71,73,70,72,73,71,71,74,71]},
columns=['Year','Country','Spending_USD','Life_Expectancy'])
spendings.groupby('Year').aggregate([min,max])
Output
2) Transformations
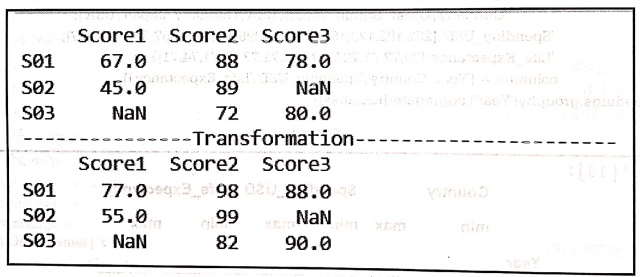
• Transformation means producing the data set
with transformed values. The transform should return a result that is same size
as group chunk.
For
example
import pandas as pd
data = pd.DataFrame({
"Score1": [67,45, None],
"Score2": [88,89,72],
"Score3" : [78, None, 80],
})
Roll No ['s01', '502', '503']
data.index = Roll_No
print(data)
print("—-Transformation---")
result = data.transform(func = lambda x: x+10)
print(result)
Output
Code explanation:
In above code
• We have first of all imported the pandas
library so that the library function for reading the
data
set can be used.
• Using pandas the DataFrame method we read out the dataframe.
•
The index is assigned to each of the
data items.
•
Using the transform function, the
transformation is applied on the data set. Inside this transform function we
have called the lambda function. A lambda function is a small anonymous function.
The syntax for lambda function is as follows ‒
lambda arguments:
expression
•
This function adds 10 to each value of
data set and returns this value to transform function. Thus as a result, we get
each value to be increased by 10 in the data set.
•
It is a common practice to use lambda
function as an argument to the transform function.
3) Filtration
•
Filtering data is a preliminary step for
any data science and machine learning application. It allows us to create
subsets from the original dataset by forming smaller dataframes. This makes it
easier to study, plot and analyze sections of the data.
•
Pandas dataframe.filter() function is used to Subset rows or columns of
dataframe according to labels in the specified index. The syntax is‒
DataFrame.filter(items=None,
like=None, regex=None, axis=None)
Parameters:
• items: List of info axis to
restrict to (must not all be present) are
• like:
Keep info axis where "arg in col= = True"
• regex: Keep info axis with
re.search(regex, col) = = True
• axis: The axis to filter
on. By default this is the info axis, 'index' for Series, 'columns' for
DataFrame
For
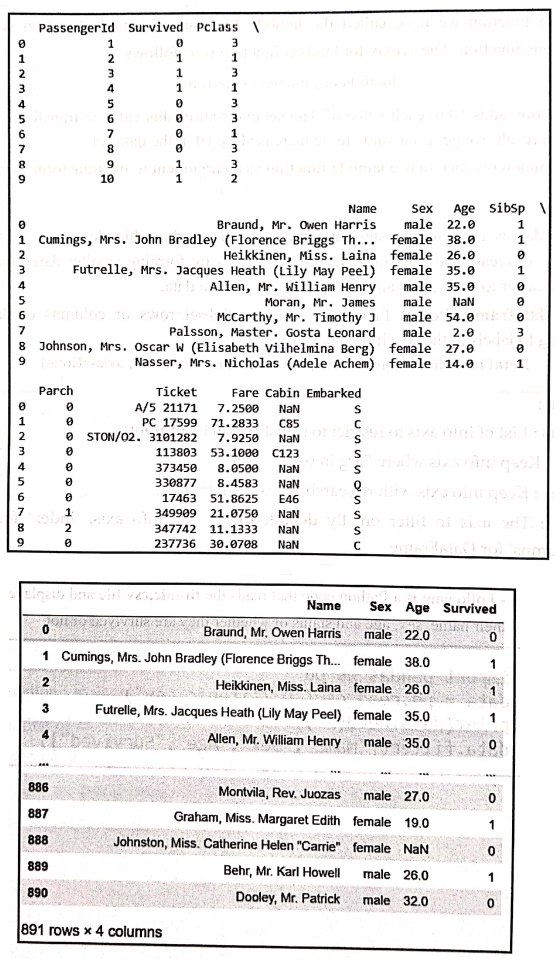
example ‒ Following is a Python code that reads the titanic.csv file and displayes the list of passengers with their
name, sex, age and status of whether they are survived or not.
In [4]:
import pandas as pd
data = pd.read_csv("D:/titanic.csv")
print(data.head(10))
data.filter(["Name", "Sex","Age",
"Survived"])
The output
Filtration based on condition using operator
Similarly
we can filter the data by selecting specific rows based on particular column
value using >, <, >=, <= and != operator
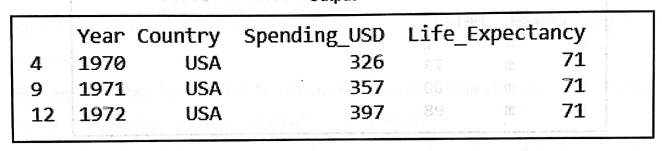
Following
code reads the data set of expenditure on health. It filters out the record of
spendings made by USA on health. The code is as follows ‒
import pandas as pd
import numpy as np
spendings = pd.DataFrame({
'Year' : [1970, 1970, 1970, 1970, 1970, 1971, 1971, 1971, 1971,
1971, 1972, 1972, 1972],
'Country': ['Germany', 'France', 'Great_Britain', 'Japan',
'USA', 'Canada' 'Germany', 'Great Britain', 'Japan', 'USA', 'Germany', 'Japan',
'USA'],
'Spending
USD':[252,192,123,150,326,313,298,134,163,357,337,185,397],
'Life Expectancy': [70,72,71,72,71,73,70,72,73,71,71,74,71]},
columns = ['Year', 'Country', 'Spending USD', 'Life
Expectancy'])
result=spendings [spendings['Country*] == 'USA']
print(result)
Output
Filtration
can be done based on the location of particular record. For getting the location
of the element in the data set we use the df.loc.
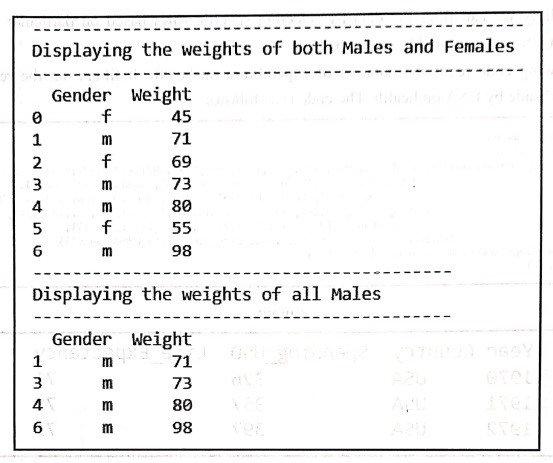
Following
example demonstrates the use of loc for
filtration
import pandas as pd
data = {'Gender': ['f','m', 'f','m', 'm', 'f', 'm'],
'weight':[45,71,69,73,80,55,98]}
df = pd.DataFrame(data)
print("----------------------------------------------")
print("Displaying the weights of both Males and
Females")
print("----------------------------------------------")
print(df)
option = ['m']
print("----------------------------------------------")
print("Displaying the weights of all Males")
print("----------------------------------------------")-")
result = df.loc[df[ 'Gender'].isin(option)]
print(result)
Output
Code explanation:
In above code,
•
First of all the pandas library file is
imported.
•
Then the data set of persons with their weights is read. It is stored in the
variable df.
•
The complete data set is then displayed.
•
Using df.loc[df['Gender'] the records of males are extracted by using the
method named isin and stored in the
variable result.
•
Finally the records containing the weights of males are displayed.
Review Questions
1.What is data
aggregation? Explain different types of aggregation functions.
2. Explain GroupBy
object with suitable example.
3. Explain
aggregation, transformation and filtration techniques in detail.
Python for Data Science: Chapter 5: NumPy and Pandas Libraries : Tag: Computer Programming, Python, Data Science : Python library - Pandas: Aggregation, Transformation and Filtration
Python for Data Science: Chapter 5: NumPy and Pandas Libraries
Under Subject

Python for Data Science
AD25201 2nd Semester AIDS Dept | 2025 Regulation | 2nd Semester 2025 Regulation
Related Subjects

English Essentials II
EN25C02 2nd Semester | 2025 Regulation | 2nd Semester 2025 Regulation

Tamils and Technology தமிழர்களும் தொழில்நுட்பமும்
UC25H02 2nd Semester | 2025 Regulation | 2nd Semester 2025 Regulation

Linear Algebra
MA25C02 2nd Semester | 2025 Regulation

Applied Physics (CSIE) II
PH25C03 2nd Semester AIDS, CSE, IT, CSE(CY) Dept | 2025 Regulation | 2nd Semester 2025 Regulation

Digital Principles and Computer Organization
CS25C06 2nd Semester AIDS, CSE, IT, CSE(CY) Dept | 2025 Regulation | 2nd Semester 2025 Regulation

Basic Electrical and Electronics Engineering
EE25C01 2nd Semester | 2025 Regulation | 2nd Semester 2025 Regulation
Python for Data Science
AD25201 2nd Semester AIDS Dept | 2025 Regulation | 2nd Semester 2025 Regulation

Re-Engineering for Innovation
ME25C05 2nd Semester | 2025 Regulation | 2nd Semester 2025 Regulation

Python for Data Science - Laboratory
AD25201 2nd Semester AIDS Dept | 2025 Regulation | 2nd Semester 2025 Regulation