Python for Data Science: Chapter 3: Foundations of Data Science
Data science process: 3. Data Preparation
Questions: 1.What is data preparation in the context of data science? Explain its importance. 2.State the main components of data preparation and briefly describe each. 3.What is data cleaning? Why is it important in data preparation? 4.Why is data preparation considered one of the most time‒consuming steps in data science? 5. List and explain five common types of data errors that can occur in datasets. 6. Describe any four common types of data transformation with suitable examples. 7.What is data combining (data integration)? Explain with an example. 8. Why is it necessary to combine data from different sources during data preparation?
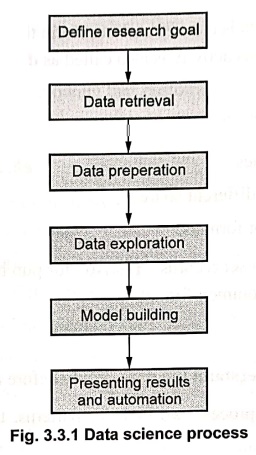
Data science process is a series of
activities that help us move from a business problem to a useful solution based
on data. 1.
Define research goals 2. Data retrieval 3. Data preparation 4. Data exploration
5. Model building 6. Presenting results and automation
3. Data Preparation
•
Data preparation is a process of getting
raw data ready for analysis and modeling. It involves cleaning, transforming and
combining data so it becomes accurate,
consistent, structured, and ready to use in machine leaning.
•
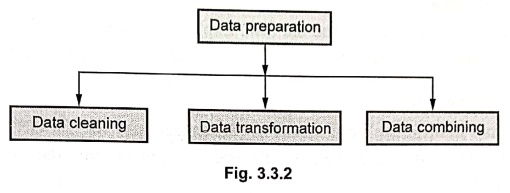
There are three main components of data
preparation 1. Data cleaning 2. Transforming and 3. Combining data
1) Data
cleaning: Data cleaning means detecting and correcting errors
or inconsistencies in the dataset. The common issues that are fixed during data
cleaning are ‒missing values, duplicate records, incorrect data types and
invalid values. For example ‒ Some "ages" are missing then fill them
with average age.
2) Data
transformation: Data
transformation means changing the format, structure, or values of the data to make
it suitable for analysis or modeling. Common transformations are ‒
Normalization / scaling, encoding categorical data, creating new variables,
changing data types and aggregating data. For example ‒ Suppose you have a
column "Date of Birth." You can transform it to calculate a new
column "Age.”
3)
Combining data: Combining data means merging multiple
datasets into one unified dataset for complete analysis. Common techniques of
combining data are ‒ merging or joining datasets, concatenation, aggregation
and data linking. For example ‒ If one file has Customer ID, Name and another
has Customer_ID, Purchase_Amount, we can merge them on Customer_ID to get a
full view of each customer.
Importance of data preparation
•
Raw data is usually incomplete, inconsistent and scattered across different
sources.
•
Without data preparation analysis results will be wrong and misleading.
•
Good data preparation improves accuracy, efficiency and model performance.
•
For example ‒ Imagine analyzing customer
data where Age has text like "twenty‒five"
and 25 mixed then the computer can't
process this correctly until we clean and convert it.
1. Data Wrangling
•
Data wrangling is the process of collecting, cleaning, transforming and
organizing raw data. It is also called as data
munging.
•
Data wrangling is a part of data preparation process.
•
Following are the steps in Data wrangling ‒
Step 1: Discovering data
•
Before working with data, understand the data. Explore the structure of that
data, identify if it has missing values or any unusual values and understand
what each column means.
Step 2: Structuring the data
•
Data often comes in different formats such as excel sheets, csv files, JSON or
XML files or it may be present in the databases. So we need to convert this
data into a common, structured format.
Step 3: Cleaning the data
•
Then the data cleaning activity starts. In this activity, we remove duplicates,
correct errors or typos, fill in missing values and fix data types.
Step 4: Transforming the data
•
We can add some new information and can make it meaningful.
Step 5: Validating the data
•
Validating means checking whether the cleaned and combining data is correct and
consistent. In this phase we mainly verify ‒ are there any errors of duplicate
values, are there the correct range of data, do the tables linked properly.
Step 6: Publishing or storing the
data
•
After cleaning and preparing we store or
export the data in a proper place so others can use it for analysis or
machine learning. For example ‒ Save the processed data into a database or a
CSV file so our analytics team can use it directly.
2. Data Cleansing
•
Data cleansing is also called as data cleaning is a subprocess of data
process that focuses on removing errors
or inconsistencies from out data.
•
The goal of data cleaning is to make data accurate,
consistent and reliable. Clean data gives correct analysis and trustworthy
results.
•
Clean data give correct analysis and
trustworthy results.
Common data errors
1. Data entry errors:
•
These errors occur during data collection or manual entry.
•
The typical reasons behind the data entry errors are Human typing mistakes,
Data entered in wrong column, error in automatic data transfer. For example
student's marks are entered as 990 instead of 99. Such mistakes can completely
change the analysis results.
•
The solution to data entry errors are ‒ 1) Use validation rules during data
entry. 2) Use drop‒down lists instead of free text. 3) Review samples of
entered data manually.
2. Redundant white spaces:
•
Sometimes, text data contains extra
spaces at the beginning or end that are hard to see ‒ but cause big
problems when matching or joining data.
•
The solution to this problem is to use string trimming functions to remove
spaces.
3. Impossible values and sanity checks:
• A sanity check is a simple logical test to
find values that are physically or logically impossible. For example ‒ age = 300
years or negative price of the item. Such values show clearly the errors in
data collection.
•
The solution to this problem is to Check for limits (e.g., Age < 120) or to
Remove or correct wrong entries manually.
4. Handling missing data:
•
A missing value occurs when no data is
recorded for a particular field. A missing data can cause problems during
analysis because many algorithms can't handle blanks.
•
For example ‒ a Student's age column is blank.
Techniques to handle missing values
Method : Description
Omit the values
‒ Remove the missing the records if they are few.
Set to NULL
‒ Keep it blank but mark as "missing".
Impute a static value
‒ Fill with a constant value like 0 or the mean.
Impute from a
distribution ‒ Use statistics or probability to
estimate the missing value.
Model the value
‒ Predict the missing value using another variable.
•
For example ‒ If 3 out of 100 students
forgot to mention their age, we can replace those missing ages with the average
age of the remaining students.
5. Outlier
•
An outlier is a data point that is very different from the rest of the
data. Sometimes outliers are valid but sometimes they are errors.
•
For example ‒ If most people's monthly
income is between₹ 30,000 and ₹50,000, but one record shows ₹5,000,000 ‒ that
is an outlier.
•
To handle the outliers ‒
1)
Use graphs like box plots or histograms to identify outliers.
2)
Check if they are valid or incorrect.
3)
If invalid, treat them as missing and remove them.
3. Data Transformation
•
Data transformation means changing the
format, structure, or values of data so that it becomes easier to analyse and
suitable for modelling. In other words, it is the process of modifying input
data to make patterns easier to detect or relationships simpler to model.
Need to Transform data (Importance)
1) The transformation on data is needed to
make relationships between variables clearer wolny and more linear.
2)
To reduce the number of variables and make the model simpler, the
transformation of the data is needed.
3)
To convert the text or categorical data into numeric form, we need to transform
the data.
4)
Data transformation is very much essential to improve model performance and accuracy.
Common types of data transformations
•
Following are the common types of data transformations ‒
1) Mathematical transformations
We
use mathematical formula to numerical data to make it easier to analyze or to
remove distortions caused by scale, skewness or non linear relationship.
•
For example ‒ When the relationship between input and output variable is non‒linear
such as
y=aebx
then taking a log on both sides make it linear.
•
Another example ‒ If income ranges from ₹10,000
to ₹10,00,000, taking log(income) reduces the wide gap, making patterns clearer
in the model.
2) Combining the variables
•
Sometimes, instead of using variables
individually, we can combine or derive a new variables that carry more
meaningful information.
•
For example ‒ In a dataset containing a person's height and weight
•
The combining the variables help in capturing hidden relationships between
features.
•
This technique of combining the variables reduces redundancy by merging similar
or related variables.
•
Common ways to combine variables are ‒
■
Mathematical
combinations such as adding, subtracting, multiplying or dividing
variables.
■
Aggregations: Combining multiple
related columns. For example total_sales Online_sales+offline_sales
■
Ratios: Creating meaningful ratios
such as income‒to‒debt ratio or price per unit.
3) Reducing the variables
• When we have too many variables (features),
it can make our model slow, confusing, or less accurate. Dimensionality
Reduction helps to keep only the most important variables.
•
This transformation technique removes irrelevant or duplicate variables that
don't add new information.
• The simplified model after reducing the
variables makes it faster and easier to interprete.
•
For example ‒ If your dataset has 50
columns describing customer behavior, but only 10 truly affect customer churn
and we reduce the 50 columns into 10 main components that still explain most of
the variation.
4) Encoding categorical data
•
Many machine learning algorithms can not process textual or categorical data,
they need numbers. So encoding is the process of transforming text
labels(categorical variables) into numeric form without changing its meaning.
•
For example if the columns named color
contains the value as red, blue or
green, then we can change it to 0,1 or 2. That means red = 0, blue = 1 and green = 2.
5) Aggregating and scaling data
•
Aggregation means summerizing
detailed data into a higher level form such as calculating totals, averages,
counts, minimums, or maximums.
•
It is very common in databases when we use SQL functions like: SUM(), AVG(),
COUNT(), MIN(), MAX() along with GROUP BY.
•
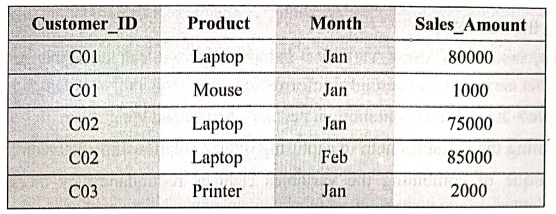
For example ‒ Consider sales database as shown below ‒
•
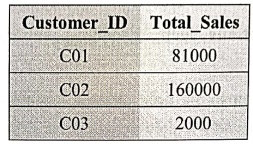
We can find total sales per customer
•
Here, we have aggregated multiple sales
records into one row per customer using SUM().
•
Scaling
means adjusting the range of numerical data so that different variables can be
compared or used together in a model.
•
For example ‒ Customer sales table as
follows –
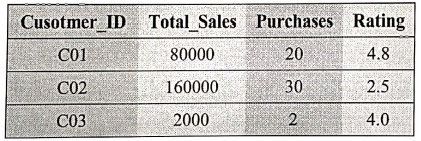
• Note that the range of each variable is ‒
■ Total_Sales
varies from 2,000 to 160,000
■
Purchases
varies from 2 to 30
■ Rating
varies from 3.5 to 4.8
We
can apply Min‒max scaling using the following formula ‒
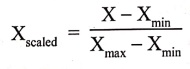
•
Now if apply scaling to the Total_Sales
column then
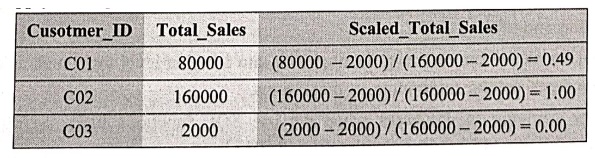
•
Note that after scaling the values are within a range of 0 to 1 and can be
comparable.
4. Combining Data
•
Data combining is the process of bringing data together from different sources
or tables into a single, unified dataset for analysis.
•
In real life, data is stored in different locations and formats ‒ Some data
might be in Excel file, Some data might be in databases like MySQL or Postgre
SQL, Or some data might be taken from sensors or API ‒ to perform meaningful
analysis we need all relevant data in one place and in consistent format.
• Hence we need the process of combining of
data.
Types of data combining operations
Data
combining can be done in different ways depending on how the data is stored and
related. Following are the types of data combining operations ‒
1) Merging or Joining
•
Merging means combining two tables using a common key. It is just like matching
rows that have something common.
•
For example ‒ Consider following two
tables ‒
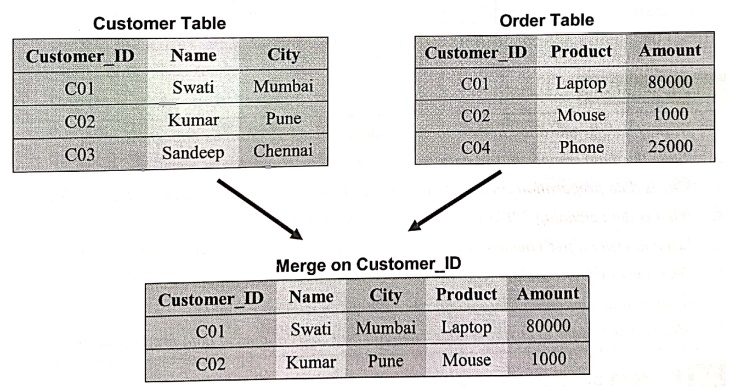
• Note that only the matching Customer_ID appear in the final table.
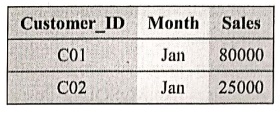
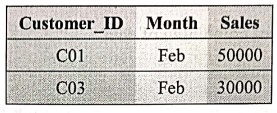
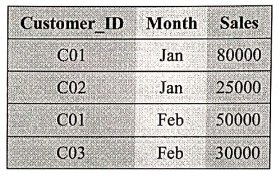
2) Concatenation
•
Concatenation means stacking datasets
vertically ‒ one below another ‒ as long as they have the same column
structure.
For example ‒ Following are the tables for two months
Jan_Sales Table
Feb_Sales Table
After
Concatenation
Sales Table
Review Questions
1.What is data
preparation in the context of data science? Explain its importance.
2.State the main
components of data preparation and briefly describe each.
3.What is data cleaning?
Why is it important in data preparation?
4.Why is data
preparation considered one of the most time‒consuming steps in data science?
5. List and explain
five common types of data errors that can occur in datasets.
6. Describe any four
common types of data transformation with suitable examples.
7.What is data
combining (data integration)? Explain with an example.
8. Why is it necessary
to combine data from different sources during data preparation?
Python for Data Science: Chapter 3: Foundations of Data Science : Tag: Computer Programming, Python, Data Science : - Data science process: 3. Data Preparation
Python for Data Science: Chapter 3: Foundations of Data Science
Under Subject

Python for Data Science
AD25201 2nd Semester AIDS Dept | 2025 Regulation | 2nd Semester 2025 Regulation
Related Subjects

English Essentials II
EN25C02 2nd Semester | 2025 Regulation | 2nd Semester 2025 Regulation

Tamils and Technology தமிழர்களும் தொழில்நுட்பமும்
UC25H02 2nd Semester | 2025 Regulation | 2nd Semester 2025 Regulation

Linear Algebra
MA25C02 2nd Semester | 2025 Regulation

Applied Physics (CSIE) II
PH25C03 2nd Semester AIDS, CSE, IT, CSE(CY) Dept | 2025 Regulation | 2nd Semester 2025 Regulation

Digital Principles and Computer Organization
CS25C06 2nd Semester AIDS, CSE, IT, CSE(CY) Dept | 2025 Regulation | 2nd Semester 2025 Regulation

Basic Electrical and Electronics Engineering
EE25C01 2nd Semester | 2025 Regulation | 2nd Semester 2025 Regulation
Python for Data Science
AD25201 2nd Semester AIDS Dept | 2025 Regulation | 2nd Semester 2025 Regulation

Re-Engineering for Innovation
ME25C05 2nd Semester | 2025 Regulation | 2nd Semester 2025 Regulation

Python for Data Science - Laboratory
AD25201 2nd Semester AIDS Dept | 2025 Regulation | 2nd Semester 2025 Regulation