Python for Data Science: Laboratory Programs in Python
Generation of correlation coefficient
Laboratory Programs in Python
Python for Data Science: Laboratory Programs in Python: Descriptive Analytics: Generation of correlation coefficient
Correlation Coefficient for Quantitative Data
• The strength of correlation is measured by correlation coefficient.
• The range of correlation coefficient is from ‒1 to 1.
• If a correlation coefficient has a value zero then that means there is no correlation.
• If the correlation coefficient has exactly ‒1 value then it is called perfect negative correlation.
• If the correlation coefficient has exactly 1 value then it is called perfect positive correlation.
• There are various types of correlation coefficients. Out of which, Pearson Product Moment Correlation is most popularly used type of method used for obtaining correlation coefficient.
• The correlation coefficient is denoted by variable r.
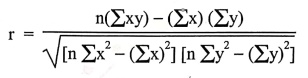
r = [ n(Σxy) – (Σx) (Σy) ] / √[n Σx2 ‒ (Ex)2] [n Σy2 ‒ (Σy)2]
where
n = Quantity of information
Σx = Total of the first variable value
Σy = Total of the second variable value
Σxy = Sum of the product of first and second value
Σx2 = Sum of the squares of the first value
Σy2 = Sum of the squares of the second value
For example ‒ Following are the values of x and y. We will find the correlation coefficient
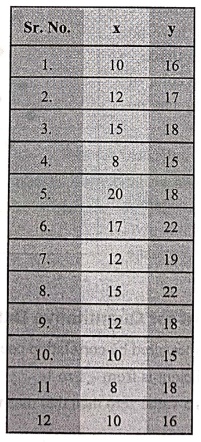
We will obtain x2, y2 and xy values.
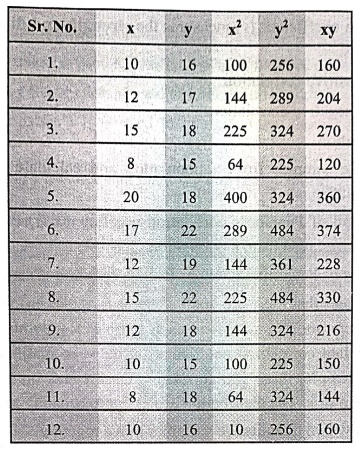
Here n is total no. of data items, it is 12.
Σx = Sum of x = 149
Σy = Sum of y = 214
Σx2 = 1909
Σy2 = 3876
Σxy = 2716
Now we will put these values in the formula –
r = [ n(Σxy) – (Σx) (Σy) ] / √[n Σx2 ‒ (Ex)2] [n Σy2 ‒ (Σy)2]
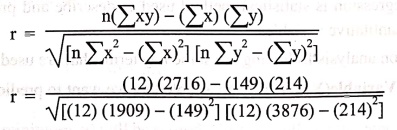
r = (12) (2716) — (149) (214) / √[(12) (1909) − (149)2] [(12) (3876) – (214)2]
r = 0.62
Thus correlation coefficient is nearer to + 1. Hence it is strong positive correlation.
1. Computational Formula for Correlation Coefficient
• Pearson's correlation coefficient (r) measures the strength and direction of a relationship between two variables.
■ If r = 1, perfect positive correlation.
■ Ifr= ‒1, perfect negative correlation.
■ If r = 0, no correlation.
• If we repeatedly take samples from a population and calculate r each time, we get a sampling distribution of r.
• This is the distribution of Pearson's correlation coefficients (r) calculated from repeated samples of the same size taken from a population.
• This distribution helps us determine if an observed correlation is statistically significant.
• For example ‒ Consider that there are 1000 students (population) whose math and science scores are noted. There are 30 students in each sample. Randomly 100 such samples are recorded. Then calculate correlation coefficient (r) between maths and science scores for each sample. When we plot these 100 correlation coefficients on a graph then we get the sampling distribution of r. The distribution of r is approximately normal.
• Correlation shows how two quantitative variables move together.
• A scatter plot gives a visual idea of the relationship, while the correlation coefficient (r) measures its strength and direction numerically.
• For quantitative data, Pearson's formula is used to computer.
Python for Data Science: Laboratory Programs in Python : Tag: Computer Programming, Python, Data Science : Laboratory Programs in Python - Generation of correlation coefficient
Python for Data Science: Laboratory Programs in Python
Under Subject

Python for Data Science
AD25201 2nd Semester AIDS Dept | 2025 Regulation | 2nd Semester 2025 Regulation

Python for Data Science - Laboratory
AD25201 2nd Semester AIDS Dept | 2025 Regulation | 2nd Semester 2025 Regulation
Related Subjects

English Essentials II
EN25C02 2nd Semester | 2025 Regulation | 2nd Semester 2025 Regulation

Tamils and Technology தமிழர்களும் தொழில்நுட்பமும்
UC25H02 2nd Semester | 2025 Regulation | 2nd Semester 2025 Regulation

Linear Algebra
MA25C02 2nd Semester | 2025 Regulation

Applied Physics (CSIE) II
PH25C03 2nd Semester AIDS, CSE, IT, CSE(CY) Dept | 2025 Regulation | 2nd Semester 2025 Regulation

Digital Principles and Computer Organization
CS25C06 2nd Semester AIDS, CSE, IT, CSE(CY) Dept | 2025 Regulation | 2nd Semester 2025 Regulation

Basic Electrical and Electronics Engineering
EE25C01 2nd Semester | 2025 Regulation | 2nd Semester 2025 Regulation
Python for Data Science
AD25201 2nd Semester AIDS Dept | 2025 Regulation | 2nd Semester 2025 Regulation

Re-Engineering for Innovation
ME25C05 2nd Semester | 2025 Regulation | 2nd Semester 2025 Regulation
Python for Data Science - Laboratory
AD25201 2nd Semester AIDS Dept | 2025 Regulation | 2nd Semester 2025 Regulation