Python for Data Science: Laboratory Programs in Python
Reindexing, and aligning data across multiple Data Frames
Laboratory Programs in Python
Python for Data Science: Laboratory Programs in Python : Numpy and Pandas Libraries : Reindexing, and aligning data across multiple Data Frames
Python program
import pandas as pd
data = [10,20,30,40]
x = pd.Series(data, index=["a","b","c","d"], dtype = float)
print(x)
index = x.index← index object
print(index)
Output
a 10.0
b 20.0
c 30.0
d 40.0
dtype: float64
Index(['a', 'b', 'c', 'd'], dtype='object')
The above output indicates that we can display the labels of indices using the index object.
Now if we want to change the label of some index then we get an error because the index objects are immutable
In [7]: index[1] = "w"
Traceback (most recent call last):
Cell In[7], line 1
index[1] = "w"
File ̰ \anaconda3\Lib\site‒packages\pandas\core\indexes\base.py:5157in_setitem_raise TypeError("Index does not support mutable operations")
TypeError: Index does not support mutable operations.
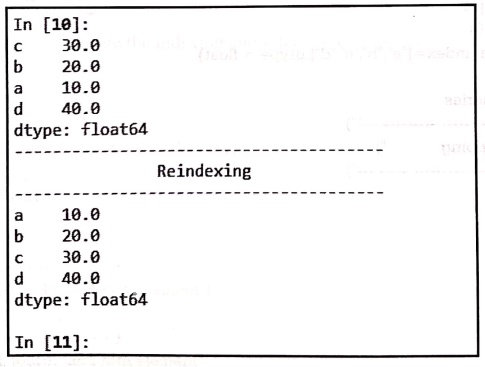
Ex 2. Reindexing
Python code
import pandas as pd
data = [30,20,10,40]
x = pd.Series(data, index=["c","b","a","d"], dtype = float)
print(x)
#calling reindex on series
print("‒‒‒‒‒‒‒‒‒‒‒‒‒‒‒‒‒‒‒‒‒‒‒‒‒‒‒‒‒‒‒")
print(" Reindexing ")
print("‒‒‒‒‒‒‒‒‒‒‒‒‒‒‒‒‒‒‒‒‒‒‒‒‒‒‒‒‒‒‒")
y = x.reindex(["a","b","c","d"])
print(y)
Output
In [10]:
c 30.0
b 20.0
a 10.0
d 40.0
dtype: float64
‒‒‒‒‒‒‒‒‒‒‒‒‒‒‒‒‒‒‒‒‒‒‒‒‒‒‒‒‒‒‒‒‒‒‒‒‒‒‒‒
Reindexing
‒‒‒‒‒‒‒‒‒‒‒‒‒‒‒‒‒‒‒‒‒‒‒‒‒‒‒‒‒‒‒‒‒‒‒‒‒‒‒‒
a 10.0
b 20.0
c 30.0
d 40.0
dtype: float64
In [11]:
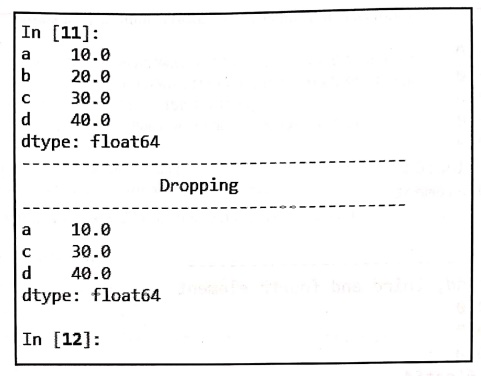
Ex 3. Drop Entry
Python code
import pandas as pd
data = [10,20,30,40]
x = pd.Series(data, index=["a","b","c","d"],dtype = float)
print(x)
#calling drop on series
print("‒‒‒‒‒‒‒‒‒‒‒‒‒‒‒‒‒‒‒‒‒‒‒‒‒‒‒‒‒‒‒‒‒")
print(" Dropping ")
print("‒‒‒‒‒‒‒‒‒‒‒‒‒‒‒‒‒‒‒‒‒‒‒‒‒‒‒‒‒‒‒‒‒")
y = x.drop(["b"])
print(y)
Output
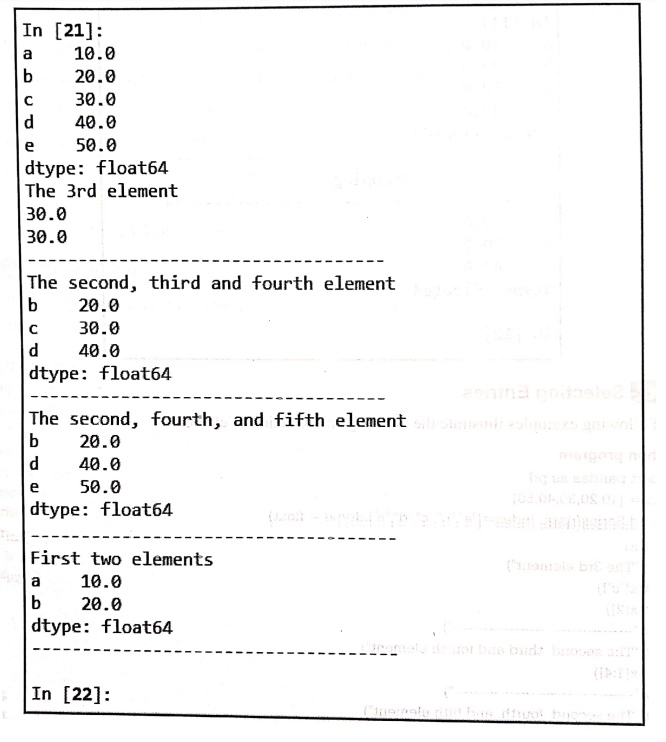
Ex 4. Selecting Entries
Python program
import pandas as pd
data = [10,20,30,40,50]
x = pd.Series(data, index=["a","b","c","d","e"], dtype = float)
print(x)
print("The 3rd element")
print(x["c"])
print(x[2])
print("‒‒‒‒‒‒‒‒‒‒‒‒‒‒‒‒‒‒‒‒‒‒‒‒‒‒‒‒‒‒‒‒‒‒‒")
print("The second, third and fourth element")
print(x[1:4])
print("‒‒‒‒‒‒‒‒‒‒‒‒‒‒‒‒‒‒‒‒‒‒‒‒‒‒‒‒‒‒‒‒‒‒‒")
print("The second, fourth, and fifth element")
print(x[[1,3,4]])
print("‒‒‒‒‒‒‒‒‒‒‒‒‒‒‒‒‒‒‒‒‒‒‒‒‒‒‒‒‒‒‒‒‒‒‒")
print("First two elements")
print(x[:2])
print("‒‒‒‒‒‒‒‒‒‒‒‒‒‒‒‒‒‒‒‒‒‒‒‒‒‒‒‒‒‒‒‒‒‒‒‒‒‒")
Output
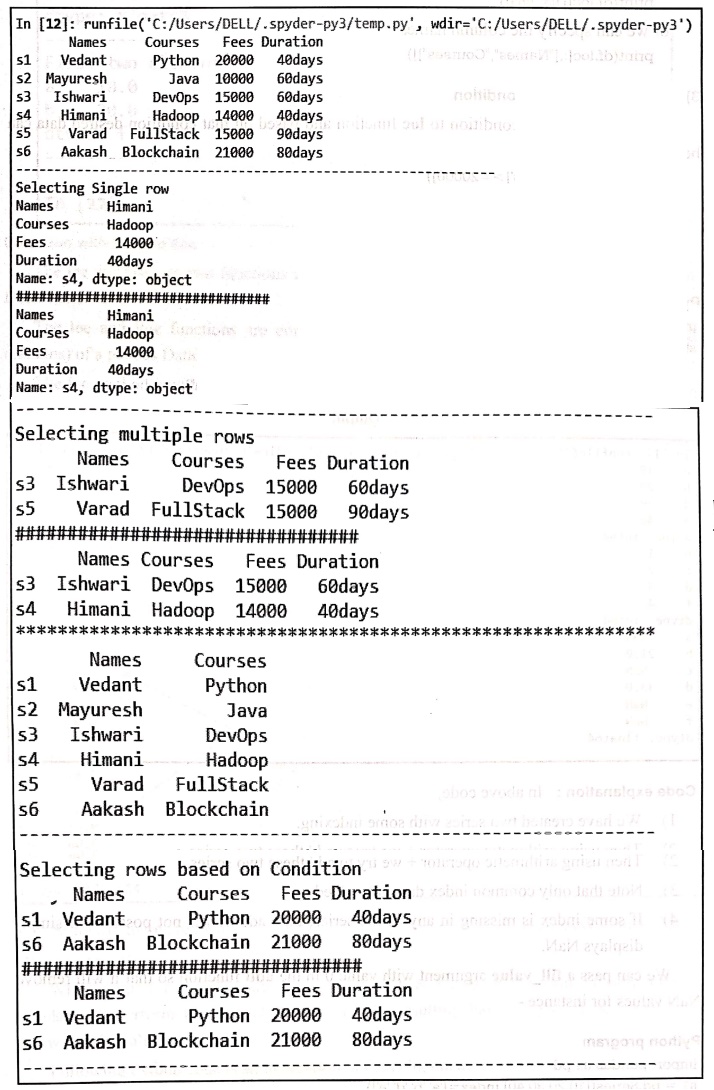
Ex 5. Selecting Entries based on condition
Python code
import pandas as pd
students ={
'Names': ["Vedant", "Mayuresh", "Ishwari","Himani","Varad","Aakash"],
'Courses':["Python","Java","DevOps","Hadoop","FullStack","Blockchain"],
'Fees':[20000,10000,15000, 14000,15000,21000],
'Duration': ['40days', '60days', '60days', '40days','90days', '80days']
}
index_labels = ['s1','s2','s3','s4','s5','s6']
df = pd.DataFrame(students, index=index_labels)
print(df)
print("‒‒‒‒‒‒‒‒‒‒‒‒‒‒‒‒‒‒‒‒‒‒‒‒‒‒‒‒‒‒‒‒‒‒‒‒‒‒‒‒‒‒‒‒‒‒‒‒‒‒‒‒‒")
print("Selecting Single row")
print(df.loc['s4'])
print("#################################")
print(df.iloc[3])
print("‒‒‒‒‒‒‒‒‒‒‒‒‒‒‒‒‒‒‒‒‒‒‒‒‒‒‒‒‒‒‒‒‒‒‒‒‒‒‒‒‒‒")
print("Selecting multiple rows")
print(df.loc[['s3','s5']])
print("#################################")
print(df.iloc[[2,3]])
print("************************************************")
print(df.loc[:,["Names","Courses"]])
print("‒‒‒‒‒‒‒‒‒‒‒‒‒‒‒‒‒‒‒‒‒‒‒‒‒‒‒‒‒‒‒‒‒‒‒‒‒‒‒‒‒‒‒‒‒‒")
print("Selecting rows based on Condition")
print(df.loc[df['Fees']>=20000])
print("#################################")
print(df.loc[list(df['Fees']>=20000)])
print("‒‒‒‒‒‒‒‒‒‒‒‒‒‒‒‒‒‒‒‒‒‒‒‒‒‒‒‒‒‒‒‒‒‒‒‒‒‒‒‒‒‒‒‒‒‒‒‒")
Output
Ex 6.
Arithmetic
Python program
import pandas as pd
s1 = pd.Series([10,20,30,40],index=['a', 'b','d', 'e'])
s2 = pd.Series([1,2,3,4],index=['b','c', 'd','f'])
print(s1)
print(s2)
print(s1+s2)
Output
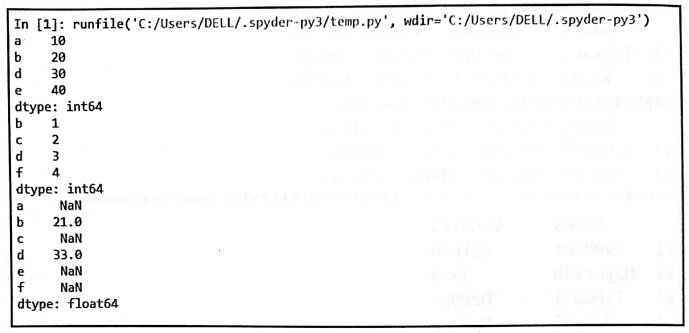
Code explanation: In above code,
1) We have created two series with some indexing.
2) Then using arithmetic operator + we try to add these two series.
3) Note that only common index data gets added.
4) If some index is missing in any of the series, then addition is not possible. It simply displays NaN.
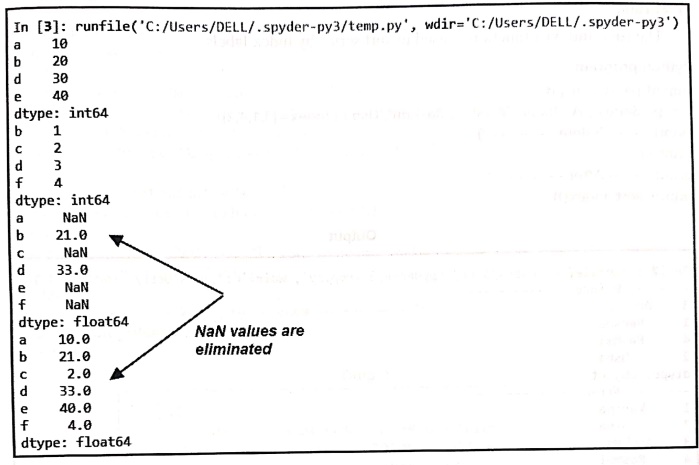
We can pass a fill_value argument with value 0 in the add function so that it will remove NaN values for instance ‒
Ex 7.
Arithmetic
Python program
import pandas as pd
s1 = pd.Series([10,20,30,40],index=['a', 'b', 'd', 'e'])
s2 = pd.Series([1,2,3,4],index=['b','c','d','f'])
print(s1)
print(s2)
print(s1+s2)
print(s1.add(s2,fill_value=0))
Output
Python program
import numpy as np
import pandas as pd
df1 = pd.DataFrame(np.arange(9).reshape(3,3), columns=['a','b','c'], index=['Red', 'Blue', 'Green'])
print(df1)
Output

Ex 8.
Sorting
Python program
import pandas as pd
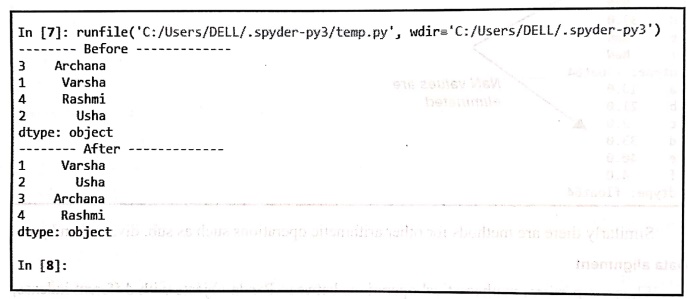
s = pd.Series(["Archana", "Varsha","Rashmi","Usha"],index=[3,1,4,2])
print("‒‒‒‒‒‒‒‒‒‒‒‒Before‒‒‒‒‒‒‒‒‒‒‒‒‒")
print(s)
print("‒‒‒‒‒‒‒‒ After ‒‒‒‒‒‒‒‒‒‒‒‒‒‒‒")
print(s.sort_index())
Output
Ex 9.
Sorting
Syntax
dataframe.sort_values(by, axis, ascending, inplace, kind, na_position, ignore_index, key)
Python code
import pandas as pd
students = {
'Names':["Vedant","Mayuresh","Ishwari","Himani","Varad","Aakash"],
'Courses':["Python","Java", "DevOps", "Hadoop","FullStack","Blockchain"],
'Fees':[20000,10000,15000,14000,15000,21000],
'Duration': ['40days', '60days', '60days','40days', '90days', '80days']
}
index_labels = ['s1','s2', 's3','s4', 's5','s6']
df = pd.DataFrame(students, index=index_labels)
print(df)
print("‒‒‒‒‒‒‒‒‒‒‒‒‒‒‒‒‒‒Sorting by Names‒‒‒‒‒‒‒‒‒‒‒‒‒‒‒‒‒‒‒‒‒‒‒")
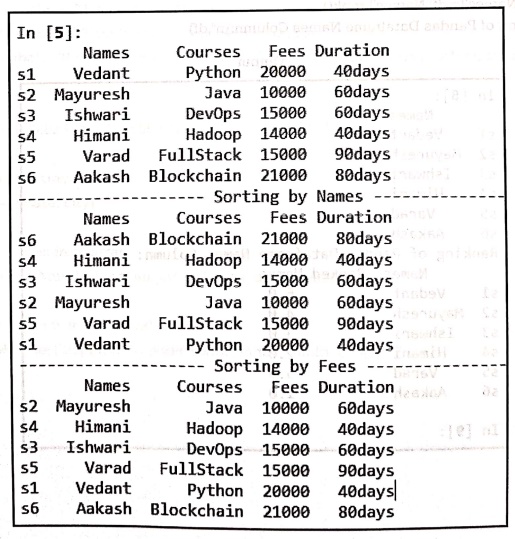
df1 = df.sort_values(by='Names')
print(df1)
print("‒‒‒‒‒‒‒‒‒‒‒‒‒‒‒‒‒‒Sorting by Courses‒‒‒‒‒‒‒‒‒‒‒‒‒‒‒‒‒‒‒‒‒‒‒")
df2 = df.sort_values(by='Fees')
print(df2)
Output
Ex 10.
Ranking
Python code
import pandas as pd
persons = {
'Names': ["Vedant","Mayuresh", "Ishwari", "Himani", "Varad","Aakash"]
}
index labels = ['s1','s2','s3°, 's4','s5','s6']
df = pd.DataFrame(persons,index=index_labels)
print(df)
df['Ranked_Names']=df['Names'].rank()
print("Ranking of Pandas Dataframe Names Column:\n",df)
Output
Code explanation: In above code,
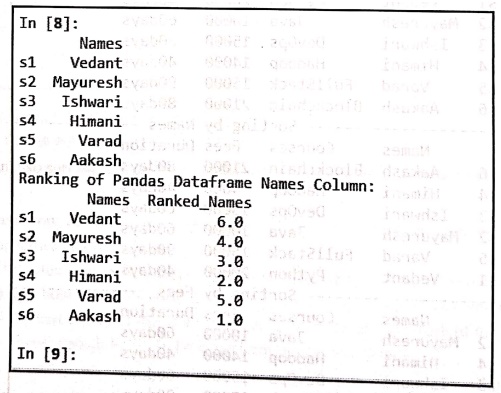
We have created a data frame containing some names. Then we have applied rank( ) function on the names column. The names are ranked alphabetically in ascending order. Another column named Ranked_Names is created and the corresponding ranks are stored in that columns.
For instance the name "Akash" has a rank 1.0, "Himani" has a rank 2.0 because alphabetically A comes before H.
Ex 12. Index Hierarchy
Python program
state = ['Maharashtra','Maharashtra','Maharashtra",
"Tamilnadu',"Tamilnadu', 'Tamilnadu', 'Gujrat', 'Gujrat','Gujrat']
city = ['Mumbai', 'Pune', 'Nasik', 'Chennai', 'Madurai', 'Puducherry', 'Ahmedabad', 'Surat', 'Vadodara']
population
= [24973000,8231000,1486053,12395000,1561129,244377,8009000,6538000,2065771]
# create array of arrays
index_array = [state, city]
# create multiindex from array
multi_index = pd.MultiIndex.from_arrays(index_array, names=['State', 'City'])
# create dataframe using multiindex
df = pd.DataFrame({'Population' :population}, index=multi_index)
print(df)
Output
Code explanation: In above code,
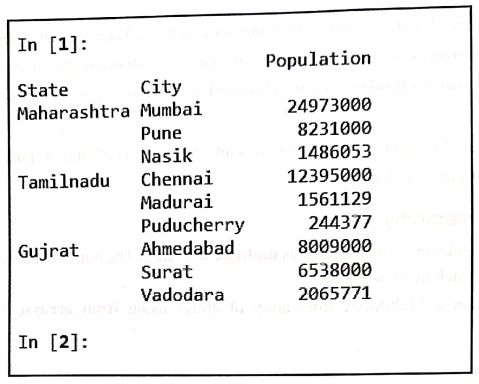
We have created a dataframe of state, city and population. We have chosen three states and three cities from each state to represent their population.
We have created a MultiIndex object named multi_index from two arrays: state and city.
We then created a DataFrame using the population array and assigned multi_index as its index. For better understanding just observe the above output.
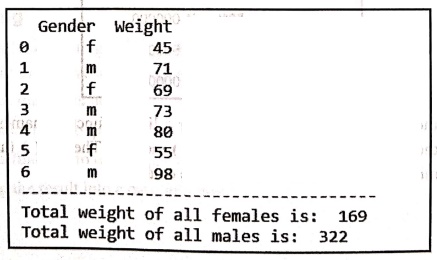
Ex 13. Summary Statistics: sum()
In [4]: import pandas as pd
data = {'Gender': ['f', 'm', 'f', 'm', 'm', 'f', 'm'], 'Weight : [45,71,69,73,80,55,98]}
df = pd.DataFrame(data)
print(df)
f = df[ 'Gender'] = = 'f'
female wt = df[f]['Weight'].sum()
print("‒‒‒‒‒‒‒‒‒‒‒‒‒‒‒‒‒‒‒‒‒‒‒‒‒‒‒‒‒‒‒‒‒‒‒‒‒‒‒‒‒‒‒‒‒‒‒")
print("Total weight of all females is: ", female_wt)
m = df['Gender'] = = 'm'
male wt ‒ df[m]['weight'].sum()
print("Total weight of all males is: ",male_wt)
Output
In [5]: import pandas as pd
data = {'Gender': ['f', 'm', 'f', , 'm', 'm', 'f', 'm'], 'Weight':[45,71,69,73,80,55,98]}
df = pd.DataFrame(data)
print(df)
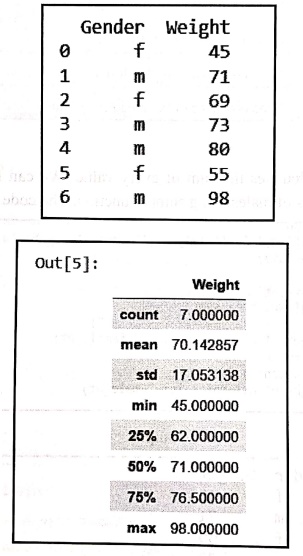
df.describe()
Output
import pandas as pd
data = {'Gender': ['f','m','f', 'm','m', 'f','m'], 'Weight': [45,71,69,73,80,55,98]}
df = pd.DataFrame(data)
print(df)
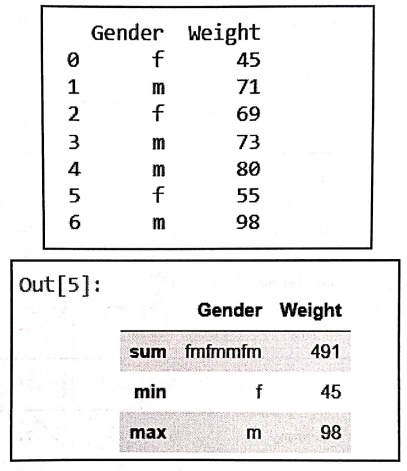
df.agg(['sum','min','max'])
Output
import pandas as pd
spendings =
pd.DataFrame({'Year: [1970, 1970, 1970, 1970, 1970, 1971, 1971, 1971, 1971, 1971,1972,1972, 1972],
'Country': ['Germany', 'France', 'Great_Britain', 'Japan', 'USA','Canada',
'Germany', 'Great_Britain', 'Japan', 'USA', 'Germany', 'Japan', 'USA'],
'Spending USD': [252,192,123,150,326,313,298,134,163,357,337,185,397],
'Life Expectancy': [70,72,71,72,71,73,70,72,73,71,71,74,71]},
columns = ['Year', 'Country','Spending_USD','Life Expectancy'])
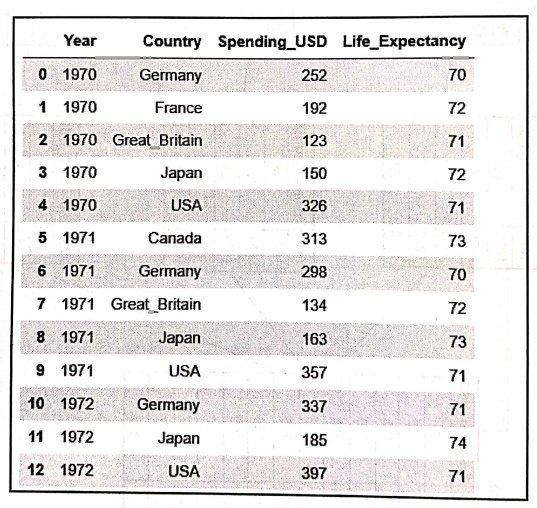
spendings
Output
Ex 17. GroupBy Object
syntax
DataFrame.groupby(by=None, axis=0, level=None, as_index=True, sort=True, group_keys=True, squeeze=False, **kwargs)
import pandas as pd
spending =
pd.DataFrame({'Year': [1970, 1970, 1970, 1970, 1970, 1971, 1971, 1971, 1971, 1971, 1972, 1972, 1972],
'Country': ['Germany', 'France', 'Great Britain', 'Japan', 'USA','Canada',
'Germany','Great Britain', 'Japan', 'USA', 'Germany', 'Japan','USA'],
'Spending USD': [252,192,123,150,326,313,298,134,163,357,337,185,397],
'Life Expectancy': [70,72,71,72,71,73,70,72,73,71,71,74,71]},
columns=['Year','Country','Spending_USD",'LifeExpectancy']) print(spendings.groupby(['Country']))
Output
<pandas.core.groupby.generic.DataFrameGroupBy object at 0x000002B50B4BB8D0>
Ex 18.
Iterating through each group
import pandas as pd
pd.DataFrame({'Year':[1970,1970, 1970, 1970, 1970, 1971, 1971, 1971, 1971, 1971, 1972, 1972, 1972],
'Country': ['Germany', 'France', 'Great_Britain', 'Japan', 'USA', 'Canada',
'Germany', 'Great Britain', 'Japan', 'USA', 'Germany', 'Japan', 'USA'],
'Spending USD': [252,192,123,150,326,313,298,134,163,357,337,185,397],
'Life Expectancy': [70,72,71,72,71,73,70,72,73,71,71,74,71]},
columns = ['Year','Country','Spending_USD', 'Life Expectancy'])
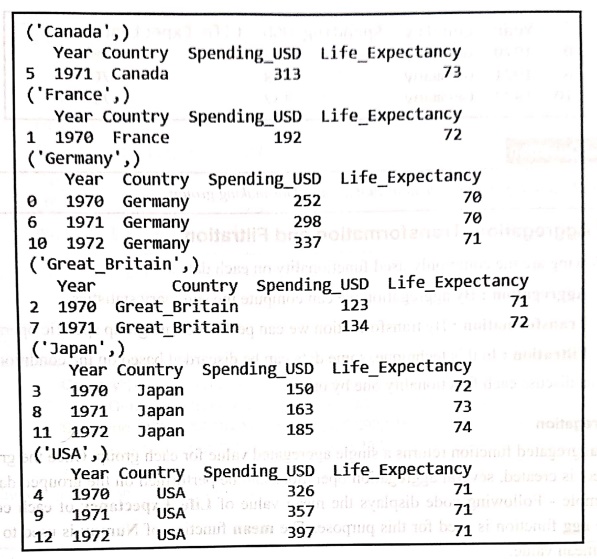
mygroup = spendings.groupby(['Country'])
for name,group in mygroup:
print(name)
print(group)
Output
Ex 19.
Getting particular group
import pandas as pd
spending =
pd.DataFrame({'Year':[1970,1970, 1970, 1970, 1970, 1971, 1971, 1971, 1971, 1971, 1972, 1972, 1972],
'Country': ['Germany', France','Great Britain', 'Japan', 'USA','Canada',
'Germany','Great_Britain', 'Japan','USA','Germany', 'Japan', 'USA'],
'Spending_USD': [252,192,123,150,326,313,298,134,163,357,337,185,397).
'Life Expectancy': [70,72,71,72,71,73,70,72,73,71,71,74,71]},
columns = ['Year','Country','Spending_USD', 'Life_Expectancy'])
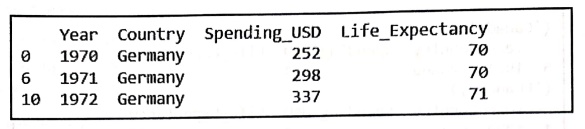
mygroup = spendings.groupby(['Country'])
print(mygroup.get_group('Germany'))
Output
Ex 20.
Aggregation
import pandas as pd
import numpy as np
spending =
pd.DataFrame({'Year':[1970, 1970, 1970, 1970, 1970, 1971, 1971, 1971, 1971, 1971, 1972, 1972, 1972],
'Country': ['Germany', 'France','Great Britain', 'Japan','USA', 'Canada,
'Germany','Great_Britain', 'Japan', 'USA','Germany', 'Japan', 'USA'],
Spending USD': [252,192,123,150,326,313,298,134,163,357,337,185,397],
'Life Expectancy': [70,72,71,72,71,73,70,72,73,71,71,74,71]},
columns = ['Year', 'Country','Spending USD','Life Expectancy'])
mygroup = spendings.groupby(['Country'])
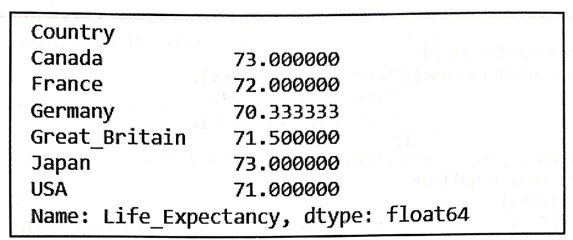
print(mygroup['Life Expectancy'].agg(np.mean))
Output
import pandas as pd
import numpy as np
spending =
pd.DataFrame({'Year':[1970, 1970, 1970, 1970, 1970, 1971, 1971, 1971, 1971, 1971, 1972, 1972, 1972],
'Country': ['Germany', 'France', 'Great Britain', 'Japan', 'USA', 'Canada',
'Germany', 'Great_Britain', 'Japan', 'USA', 'Germany', 'Japan', 'USA'],
'Spending_USD': [252,192,123,150,326,313,298,134,163,357,337,185,397],
'Life Expectancy': [70,72,71,72,71,73,70,72,73,71,71,74,71]},
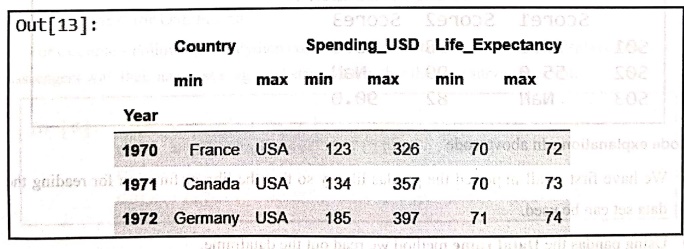
columns=['Year','Country','Spending_USD','Life_Expectancy']) spendings.groupby('Year').aggregate([min,max])
Output
Ex 21.
Transformation
import pandas as pd
data = pd.DataFrame({
"Score1": [67,45, None],
"Score2": [88,89,72],
"Score3" : [78, None, 80],
})
Roll No ['s01', '502', '503']
data.index = Roll_No
print(data)
print("—-Transformation---")
result = data.transform(func = lambda x: x+10)
print(result)
Output
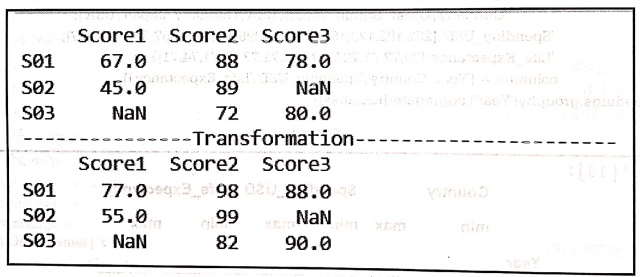
Code explanation: In above code
• We have first of all imported the pandas library so that the library function for reading the
data set can be used.
• Using pandas the DataFrame method we read out the dataframe.
• The index is assigned to each of the data items.
Ex 22.
Filtration
In [4]: import pandas as pd
data = pd.read_csv("D:/titanic.csv")
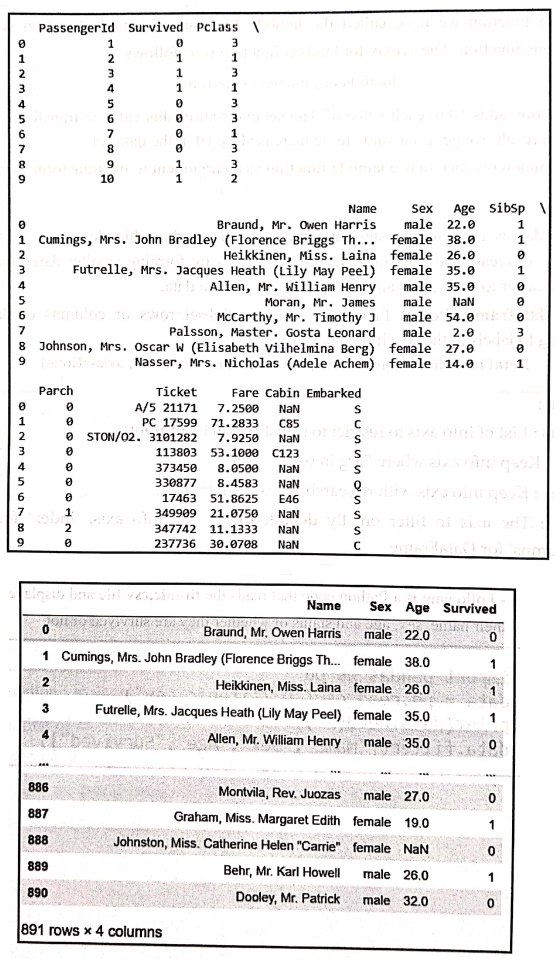
print(data.head(10))
data.filter(["Name", "Sex","Age", "Survived"])
The output
Ex 23. Filtration based on condition using operator
import pandas as pd
import numpy as np
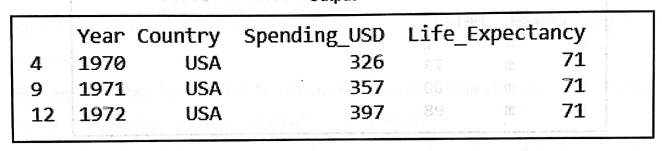
spendings = pd.DataFrame({
'Year' : [1970, 1970, 1970, 1970, 1970, 1971, 1971, 1971, 1971, 1971, 1972, 1972, 1972],
'Country': ['Germany', 'France', 'Great_Britain', 'Japan', 'USA', 'Canada' 'Germany', 'Great Britain', 'Japan', 'USA', 'Germany', 'Japan', 'USA'],
'Spending USD':[252,192,123,150,326,313,298,134,163,357,337,185,397],
'Life Expectancy': [70,72,71,72,71,73,70,72,73,71,71,74,71]},
columns = ['Year', 'Country', 'Spending USD', 'Life Expectancy'])
result=spendings [spendings['Country*] == 'USA']
print(result)
Output
Ex 24. Filtration based on condition using operator
import pandas as pd
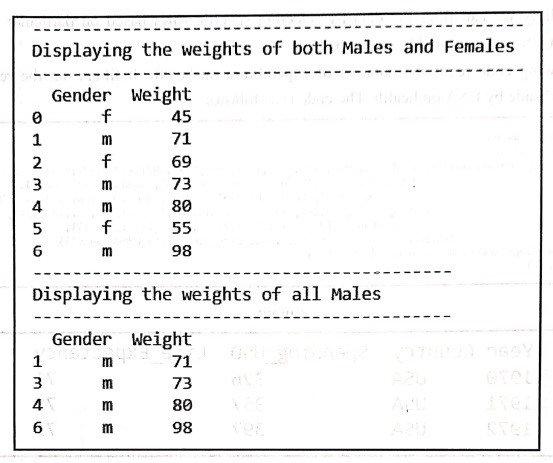
data = {'Gender': ['f','m', 'f','m', 'm', 'f', 'm'], 'weight':[45,71,69,73,80,55,98]}
df = pd.DataFrame(data)
print("----------------------------------------------")
print("Displaying the weights of both Males and Females")
print("----------------------------------------------")
print(df)
option = ['m']
print("----------------------------------------------")
print("Displaying the weights of all Males")
print("----------------------------------------------")-")
result = df.loc[df[ 'Gender'].isin(option)]
print(result)
Output
Code explanation: In above code,
• First of all the pandas library file is imported.
• Then the data set of persons with their weights is read. It is stored in the variable df.
• The complete data set is then displayed.
Ex 25.
merge
import pandas as pd
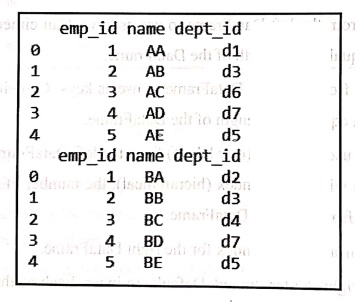
data1 = pd.DataFrame({
'emp_id':[1,2,3,4,5],
'name':['AA', 'AB', 'AC', 'AD', 'AE'].
'dept_id': ['d1', 'd3', 'd6', 'd7', 'd5']}).
data2 = pd.DataFrame({
'emp_id':[1,2,3,4,5],
'name': ['BA', 'BB', 'BC', 'BD', 'BE'],
'dept_id': ['d2', 'd3', 'd4', 'd7', 'd5']})
print(data1)
print(data2)
Output
import pandas as pd
data1 = pd.DataFrame({
'emp_id':[1,2,3,4,5],
'name': ['AA', 'Ab', 'Ac', 'AD', 'AE'],
'dept_id':['d1', 'd3', 'd6', 'd7','d5']})
data2 = pd.DataFrame({
'emp_id':[1,2,3,4,5],
'name': ['BA', 'BB', 'BC', 'BD', 'BE'],
'dept_id': ['d2', 'd3', 'd4', 'd7', 'd5']})
print(data1)
print(data2) print("
print("-----------------------------")
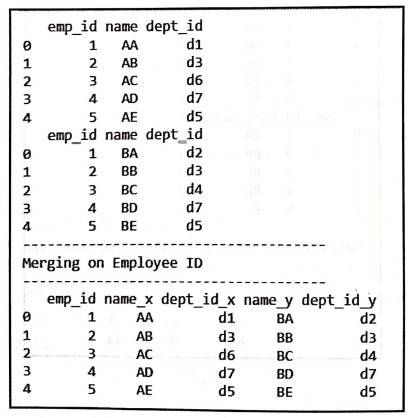
print("Merging on Employee ID")
print("-----------------------------")
print(pd.merge(data1, data2,on='emp_id'))
Output
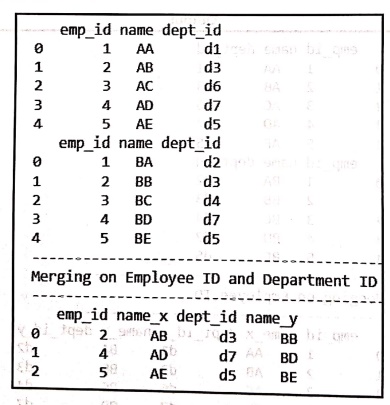
Ex 27.
Merging of datasets using multiple keys
import pandas as pd
data1 = pd.DataFrame({
'emp_id':[1,2,3,4,5],
'name': ['AA', 'AB', 'AC', 'AD', 'AE'],
'dept_id': ['d1', 'd3', 'd6', 'dz', 'd5']})
data2 = pd.DataFrame({
'emp_id':[1,2,3,4,5],
'name':['BA', 'BB', 'BC', 'BD', 'BE'],
dept id': ['d2', 'd3', 'd4', 'd7', 'd5']})
print(data1)
print(data2)
print("-----------------------------")
print("Merging on Employee ID and Department _ID")
print("-----------------------------")
print(pd.merge(data1,data2,on=['emp_id', 'dept_id']))
Output
Ex 28.
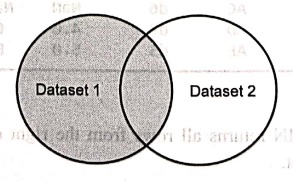
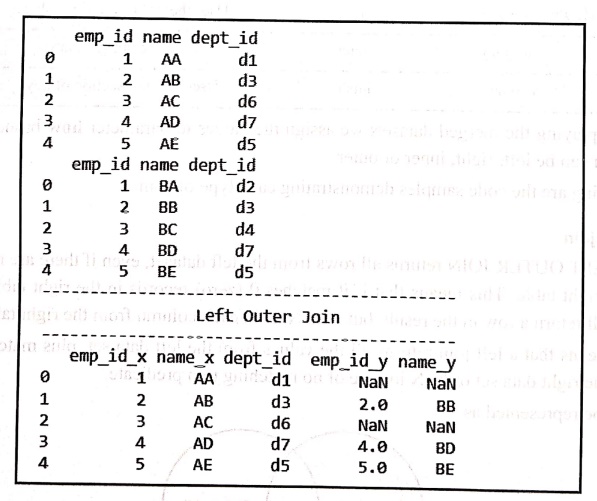
Left outer join
import pandas as pd
data1 = pd.DataFrame({
'emp_id':[1,2,3,4,5],
'name': ['AA', 'AB', 'AC', 'AD', 'AE'],
'dept_id': ['d1', 'd3', 'd6', 'd7', 'd5']})
data2 = pd.DataFrame({
'emp_id':[1,2,3,4,5],
'name': ['BA', 'BB', 'BC', 'BD', 'BE'],
'dept_id': ['d2', 'd3', 'd4', 'd7', 'd5']})
print(data1)
print(data2)
print("----------------")
print(" Left Outer Join")
print("----------------")
print(pd.merge(data1, data2, on = 'dept_id', how = 'left'))
Output
Ex 29.
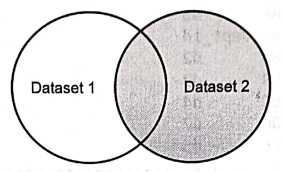
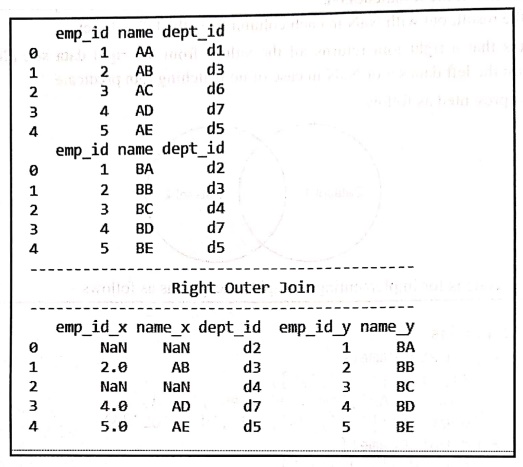
Right outer join
import pandas as pd
data1 = pd.DataFrame({
'emp_id':[1,2,3,4,5],
'name': ['AA', 'AB', 'AC', 'AD', 'AE'],
'dept_id': ['d1', 'dз', 'd6', 'd7', 'd5']})
data2 = pd.DataFrame({
emp_id':[1,2,3,4,5],
name': ['BA', 'BB', 'BC', 'BD', 'BE'],
'dept_id': ['d2', 'd3', 'd4', 'd7', 'd5']})
print(data1)
print(data2)
print("-------------------------------")
print(" Right Outer Join")
print("-------------------------------")
print (pd.merge(data1, data2,on = 'dept_id', how = 'right'))
Output
Ex 30.
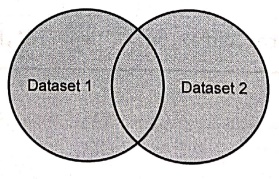
Full outer join
import pandas as pd
data1 = pd.DataFrame({
'emp_id':[1,2,3,4,5],
'name': ['AA', 'AB', 'AC', 'AD', 'AE'],
'dept_id': ['d1', 'dз', 'd6', 'd7', 'd5']})
data2 = pd.DataFrame({
'emp_id':[1,2,3,4,5],
'name': ['BA', 'BB', 'BC', 'BD', 'BE'],
'dept_id': ['d2', 'd3', 'd4', 'd7', 'd5']})
print(data1)
print(data2)
print("-----------------------------")
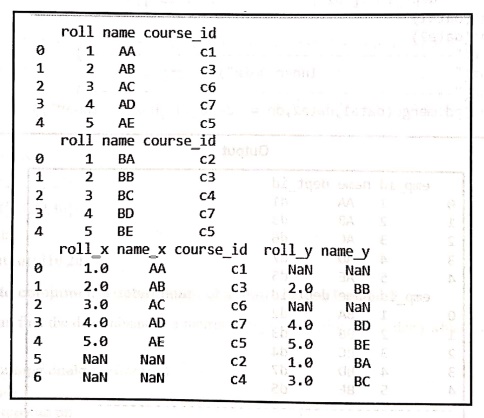
print(" Full Outer Join")
print("-----------------------------")
print(pd.merge(data1, data2, on = 'dept id', how = 'outer'))
Output
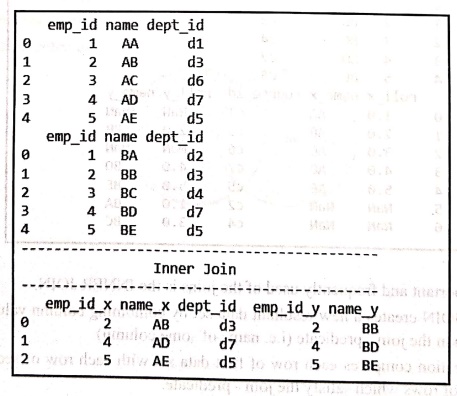
Ex 31.
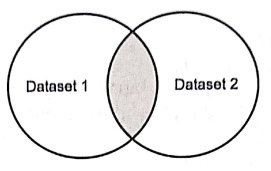
Inner join
import pandas as pd
datal = pd.DataFrame({
'emp_id':[1,2,3,4,5],
'name': ['AA', 'AB', 'Ac', 'AD','ÁE'],
'dept_id': ['d1', 'd3', 'd6', 'd7', 'd5']})
data2 = pd.DataFrame({
emp_id':[1,2,3,4,5],
'name': ['BA', 'BB', 'BC', 'BD','BE'],
'dept_id': ['d2', 'd3', d4', 'd7', 'd5']})
print(data1)
print(data2)
print("-------------------")
print(" Inner Join")
print("-------------------")
print(pd.merge(data1, data2,on = 'dept_id',how = 'inner'))
Output
Python for Data Science: Laboratory Programs in Python : Tag: Computer Programming, Python, Data Science : Laboratory Programs in Python - Reindexing, and aligning data across multiple Data Frames
Python for Data Science: Laboratory Programs in Python
Under Subject

Python for Data Science
AD25201 2nd Semester AIDS Dept | 2025 Regulation | 2nd Semester 2025 Regulation

Python for Data Science - Laboratory
AD25201 2nd Semester AIDS Dept | 2025 Regulation | 2nd Semester 2025 Regulation
Related Subjects

English Essentials II
EN25C02 2nd Semester | 2025 Regulation | 2nd Semester 2025 Regulation

Tamils and Technology தமிழர்களும் தொழில்நுட்பமும்
UC25H02 2nd Semester | 2025 Regulation | 2nd Semester 2025 Regulation

Linear Algebra
MA25C02 2nd Semester | 2025 Regulation

Applied Physics (CSIE) II
PH25C03 2nd Semester AIDS, CSE, IT, CSE(CY) Dept | 2025 Regulation | 2nd Semester 2025 Regulation

Digital Principles and Computer Organization
CS25C06 2nd Semester AIDS, CSE, IT, CSE(CY) Dept | 2025 Regulation | 2nd Semester 2025 Regulation

Basic Electrical and Electronics Engineering
EE25C01 2nd Semester | 2025 Regulation | 2nd Semester 2025 Regulation
Python for Data Science
AD25201 2nd Semester AIDS Dept | 2025 Regulation | 2nd Semester 2025 Regulation

Re-Engineering for Innovation
ME25C05 2nd Semester | 2025 Regulation | 2nd Semester 2025 Regulation
Python for Data Science - Laboratory
AD25201 2nd Semester AIDS Dept | 2025 Regulation | 2nd Semester 2025 Regulation