Applied Calculus: UNIT I: Differential Calculus
Representation of functions
Differential Calculus
There are four possible ways its represent a function • Algebraically • Numerically • Visually • Verbally | Explanation, Formula, Equation, Example and Solved Problems
REPRESENTATION OF FUNCTIONS
There are four possible
ways its represent a function
• Algebraically
• Numerically
• Visually
• Verbally
Each one of them has
some advantages and disadvantages. Let us look at them one at a time and try to
understand them.
Representation of a function‒ Algebraic
It is one of the usual
representations of functions. In this, functions are explicitly represented
using formulas. The functions are generally denoted by lower case alphabet
letters.
Example for the
functions that represented by algebraically are
1. The area A of a
circle depends on the radius r of the
circle. The rule that connects r and
A is given by the equation A = πr2. With each positive number r, there is associated one value of A,
and we say that A is a function of r.
2. The algebraic
function y = x2. The rule that connects x and y given by the
above equation.
3. The trigonometric
function y = cos x.
4. The exponential
function y = ex.
5. The logarithmic
function y = log x.
Though one of the easy
and understandable ways of representing a function, it is not always easy to
get the formula of the function. For those cases, we use other
methods of
representation.
Representation of a function‒ Visual
This is basically the
graphical representation of functions. This is very easy to understand. The
input values are marked along the x‒axis.
For any input value, the corresponding output value is the vertical
displacement from the x‒axis. For example at x= a, the output is equal to f(a).
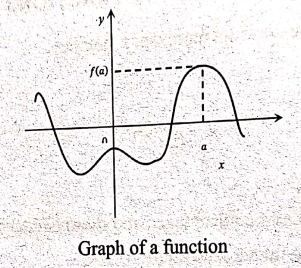
The graph shows the
properties of the functions. For example from Figure 1, we can directly tell:
• where the graph is
increasing or decreasing
• where the rate of
change is more and where it is less
• where are the extrema
Thus, graphs are very
beneficial for studying the behavior of the function. One drawback though it
that we can't always get the exact values of all the outputs from the graph.
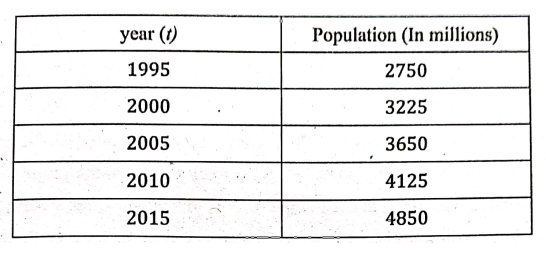
Representation of a function‒ Numerical
This is basically the
tabular way of representing a function. The table contains two columns; one
with the dependent variable and other with the independent variable. To show
with an example, let us take a function f
and independent variable as x. So, the dependent variable will be equal to
(x). The table is given as:
The human population P
in the world depends on time t. The following table gives estimates of the
population P(t) at the time t, certain years. For instance,
P(2005) = 3,650,000,000
But for each value of
the time t there is a corresponding
value of P, and we say
that P is a function of
t.
Table 1: Table
representing a function
Though we have the
exact value of the outputs, we can only have a finite number of such outputs.
The analysis of the function and study of its behavior hence becomes difficult.
Representation of a function‒ Verbal
The cost C of mailing a
large envelope depends on the weight w of the envelope. Even though, there is
no simple formula connecting C and w, the post office has a method for deciding
the C when w is known,
Many times functions
are described more "naturally" by one method than another.
For example,
• Rather than looking
at a table of values for the population of a country based on the year, it is
easier to look at a graph to quickly see the trend.
• It is more useful to
represent the area of a circle as a function of its radius algebraically (A = πr2),
than it is to compile a table of values.
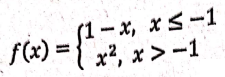
1. PIECEWISE DEFINED FUNCTION.
A piecewise‒defined
function (also called a piecewise function or a hybrid function) is a function
which is defined by multiple sub‒function, each sub‒function applying to a certain
interval of the main function's domain (a sub‒ domain).
Consider a function
defined by
Plotting the graph of
the above function,
we get
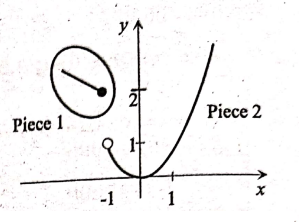
The solid dot indicates
that the point (‒1,2) is included on the graph; the open dot indicates that the
point (‒1,1) is excluded from the graph. Since there is a break in the graph at
the point x = ‒1, this is an example for a piecewise defined function.
Suppose that if we want
to find the values of f(‒2), f(‒1) and f(0), then we have to use the definition of the function with
respect to the values of x. For example, to find f(‒2), we have to consider the value of f(x) = 1−x, since the
value of x≤‒1. Therefore, value of f(‒2) = 1 ‒ (‒2) = 3. Similarly, the
value of f(‒1)=1‒(‒1) = 2. To find
the value of f(0), we have to use the
value of f(x) = x2, since the value of x>‒1. Therefore, f(0) = 0.
ABSOLUTE
FUNCTION
The absolute value of a
number a is denoted by |a| which is the distance from a to 0 on the real number line. Note
that distances are always positive or zero. |a| ≥ 0 for every number a.
Example, |‒3| = 3, |3|
= 3,
|3‒e| = 3‒e [3>e]
|3‒π|=π‒3 [π > з]
In general, |a| = a, if
a ≥ 0 and
|a|
[a] = ‒a, if a <0
2. PROBLEMS UNDER DOMAIN AND RANGE
Domain is the interval
in which the values of x lie.
Range is the interval
in which the values of f (x) lie.
Example
1.
Sketch
the graph of the function f(x) = 2.0 ‒
0.4x and find the domain of the
function.
Solution:
y = 2.0‒0.4x ... (1)
To find the x intercept, put y = 0 in (1),we get.
0=2‒0.4x
0.4x = 2
x =2/0.4
x=5
The x intercept
is (5,0)
To find the y intercept, put x = 0 in (1),we get
y = 2
The y intercept is (0,2)
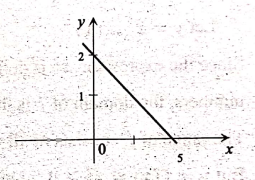
The graph of the given
function is
Domain: (‒∞, ∞)
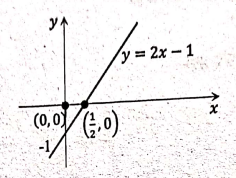
Example
2. Sketch the graph of the function f(x)
= 2x‒1 and find the domain and range
of the function.
Solution:
Given f(x) = 2x‒1
Let y=2x‒1... (1)
To find the x intercept, put y = 0 in (1), we get
0=2x‒1
2x = 1⇒ x=1/2
.. the x intercept is (1/2,0)
To find the y intercept, put x = 0 in (1), we get
y = ‒1
..the y intercept is (0,‒1).
Since the expression 2x‒1
is defined for all real numbers, the domain of f is
the set of real
numbers.
Since for each real
number x, there is a real number f(x). Hence the range of f is the set of real numbers.
Example
3. Sketch the graph of a function f(x)
= x2 and find the domain
and range of the function.
Solution:
Given f(x) = x2
Let y = x2 ... (1)
Since the expression x2 is defined for all real numbers,
the domain of f is the set of real
numbers.

The range of f consists of all values of f(x).
But y = f(x) = x2
≥ 0 for all values of x.
∴
The range of ƒ is {y/y ≥ 0} = [0,∞)
Example
4. Sketch the function f(x) = x (absolute function)
Solution:
Given f(x) = |x|
The definition of
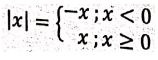
and therefore, the
function f(x) can be defined as

Therefore the graph of
ƒ coincides with the line y = x to the right of y‒axis and coincides
with the line y = ‒x to the left of y‒axis and the sketch of the function is given below.

Example
5. Sketch the graph of the function f(x)
= 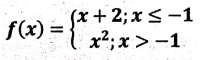 and find the domain of the function.
Solution:
Given f(x) = x + 2 if x ≤ ‒1
Let y = x + 2 ... (1)
Which is a straight
line in (‒∞, ‒1].
To find the x intercept, put y = 0 in (1), we get
0=x+2
x= ‒2
the x intercept is (‒2,0)
Since f(x) = x + 2 if x ≤ ‒1, there
is no y intercept.
Also given f(x) = x2 if x > ‒1
Which is a parabola
with vertex (0,0) in (−1,∞).
The domain is (‒∞, ‒1]
U (‒1,∞).
Therefore the domain is
(‒∞, ∞).
Example
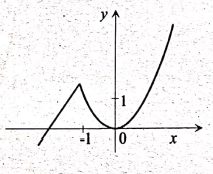
6. Sketch the graph of the function 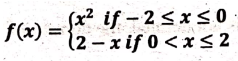
Solution:
Given
First consider y = x2,
if ‒2 ≤ x ≤ 0.
Which is a Parabola in ‒2
≤ x ≤ 0.
Next consider y = 2‒x, if 0 < x < 2 ... (1)
To find the x intercept, put y = 0 in (1), we get
0=2‒x
x=2
∴
The x intercept is (2, 0)
To find the y intercept, put x = 0 in (1), we get
y
= 2
The y intercept is (0,2)
The graph of the given
function is

Example
7. Find the domain and range of a function f(x)
= √x.
Solution:
Since square root of
negative number is not defined, the domain of f consists of all values x such
that x ≥0.
.. the domain is the
interval [0, ∞).
The range of f consists of all values of f(x). But f(x) = √x ≥ 0 for all values of
x in the domain.
..the domain is the
interval [0, ∞).
Example
8. Find the domain and range of the function (x) = √[x +2].
Solution:
Given f(x) = √[x + 2]
Since square root of
negative number is not defined, the domain of ƒ consists of
all values x such that
x+2≥0 ⇒ x ≥ −2.
..the domain is the
interval [‒2,∞).
The range of ƒ consists
of all values of f(x). But f(x) = √[x + 2] ≥ 0 for all values of x in the domain.
.. the domain is the
interval [0, ∞).
Example
9. Find the domain and range of the function (x) = √[1 ‒ x2].
Solution:
Given f(x) = √[1 − x2]
Since square root of
negative number is not defined, the domain of ƒ consists of all values x such that 1 ‒ x2 ≥0.
‒x2‒1⇒
x2 ≤1
⇒
|x|2 ≤ 1 ⇒
|x| ≤ 1
‒1≤ x
≤1
..the domain is the
interval [‒1,1].
The value of 1‒x2 vary from 0 to 1 on the
given domain. Also f(x) = √[1‒x2] vary from 0 to 1 on the
given domain.
The range of f is [0,1].
Example
10. Find the domain of the function f(x)
= √[3‒x]‒√[2+x].
Solution:
Given f(x)= √[3‒x]‒√[2+x]
Since square root of
negative number is not defined, the domain of ƒ consists of all values x such that √[3‒x]‒√[2+x] ≥ 0.
Hence 3‒x > 0 and 2
+ x ≥ 0;
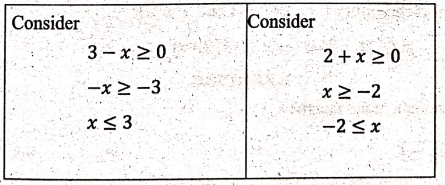
‒2≤x≤3
the domain is the
interval [‒2,3].
Example
11. Find the domain and range of the function f(x)=1/x
Solution:
Given f(x) = 1/x
Let y = 1/x
y=1/x is not defined at x = 0.
..the domain is the
interval (x/x ≠ 0} = (‒∞, 0) U (0, ∞)
Since reciprocal of non‒zero
real number is a real number,
The range of f = (‒∞, 0) U (0, ∞)
Example
12. Find the domain of the function 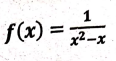
Solution:
Given
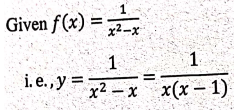
f(x)
is undefined at x = 0 and x = 1
..the domain is the
interval {x/x ≠ 0 and x ≠ 1}
= (‒∞, 0) U (0,1) U (1,∞)
Example
13. Find the domain of the function f(x)
=
[ 2x3‒5 ] / [ x2+x‒6 ]
Solution:
Given
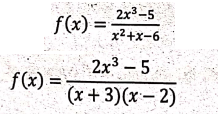
f(x)
is undefined at x = ‒3 and x = 2.
.. the domain is the
interval {x/x ≠ ‒3 and x ≠ 2}
= (‒∞,‒3) U (‒3, 2) U (2, ∞)
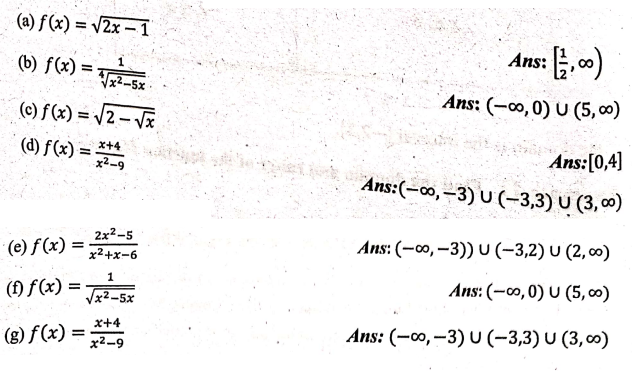
EXERCISE
1. Find the domain of
the functions
2. Find the domain and
sketch the graph of the functions

Applied Calculus: UNIT I: Differential Calculus : Tag: Applied Calculus : Differential Calculus - Representation of functions
Applied Calculus: UNIT I: Differential Calculus
Under Subject
Applied Calculus
MA25C01 Maths 1 M1 - 1st Semester | 2025 Regulation | 1st Semester 2025 Regulation
Related Subjects

English Essentials I
EN25C01 1st Semester | 2025 Regulation | 1st Semester 2025 Regulation

தமிழர் மரபு - Heritage of Tamils
UC25H01 1st Semester | 2025 Regulation | 1st Semester 2025 Regulation
Applied Calculus
MA25C01 Maths 1 M1 - 1st Semester | 2025 Regulation | 1st Semester 2025 Regulation

Applied Physics I
PH25C01 1st Semester | 2025 Regulation | 1st Semester 2025 Regulation

Applied Chemistry I
CY25C01 1st Semester | 2025 Regulation | 1st Semester 2025 Regulation

Makerspace
ME25C04 1st Semester | 2025 Regulation | 1st Semester 2025 Regulation

Computer Programming C
CS25C01 1st Semester | 2025 Regulation | 1st Semester 2025 Regulation

Computer Programming Python
CS25C02 1st Semester | 2025 Regulation | 1st Semester 2025 Regulation

Fundamentals of Electrical and Electronics Engineering
EE25C03 1st Semester | 2025 Regulation | 1st Semester 2025 Regulation

Introduction to Mechanical Engineering
ME25C03 1st Semester | 2025 Regulation | 1st Semester 2025 Regulation

Introduction to Civil Engineering
CE25C01 1st Semester Civil Department | 2025 Regulation | 1st Semester 2025 Regulation
Essentials of Computing
CS25C03 1st Semester - AID CSE IT Department | 2025 Regulation | 1st Semester 2025 Regulation

Applied Physics I Laboratory
PH25C01 1st Semester practical Laboratory Manual | 2025 Regulation | 1st Semester Laboratory 2025 Regulation

Applied Chemistry I Laboratory
CY25C01 1st Semester practical Laboratory Manual | 2025 Regulation | 1st Semester Laboratory 2025 Regulation

Computer Programming C Laboratory
CS25C01 1st Semester practical Laboratory Manual | 2025 Regulation | 1st Semester Laboratory 2025 Regulation

Computer Programming Python Laboratory
CS25C02 1st Semester practical Laboratory Manual | 2025 Regulation | 1st Semester Laboratory 2025 Regulation
Engineering Drawing
ME25C01 EEE Mech Dept | 2025 Regulation | 2nd Semester 2025 Regulation

Basic Electronics and Electrical Engineering
EE25C04 1st Semester ECE Dept | 2025 Regulation | 2nd Semester 2025 Regulation