Applied Calculus: UNIT I: Differential Calculus
Transformations of functions
New functions from old function | Differential Calculus
Explanation, Formula, Equation, Example and Solved Problems - Differential Calculus: New functions from old function: Transformations of functions
TRANSFORMATIONS OF FUNCTIONS
By applying certain transformations to the graph of a given function we can obtain the graphs of certain related functions. This will give us the ability to sketch the graphs of many functions quickly by hand. It will also enable us to write equations for given graphs.
TRANSLATION
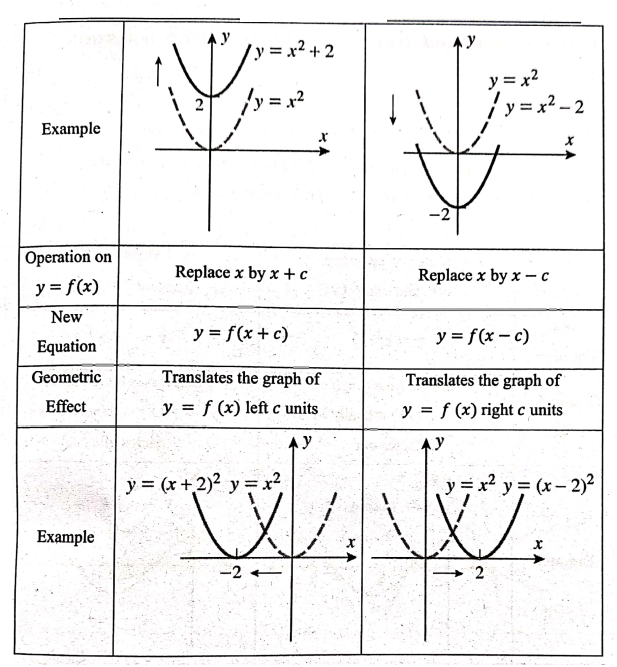
Now let's consider the translation transformations. If c is a positive number. then the graph of y = f(x)+c is just the graph of y = f(x) shifted upward a distance of c units (because each y‒coordinate is increased by the number c).
By the similar way, the graph of y = f(x) ‒ c is just the graph of y = f(x) shifted downward a distance of c units (because each y‒coordinate is decreased by the number c).
The graph of y = f(x + c), where c> 0, then is just the graph of y = f(x) shifted c units to the left. By the similar way, the graph of y = f(x‒ c) is just the graph of y = f(x) shifted c units to the right.
VERTICAL AND HORIZONTAL SHIFTS
Suppose c>0 To obtain the graph of
• y = f(x) + c shift the graph of y = f(x) a distance c units upward
• y = f(x) c shift the graph of y = f(x) a distance c units downward
• y = f(x + c) shift the graph of y = f(x) distance c units to the left.
• y= f(x‒c) shift the graph of y = f(x) distance c units to the right

STRETCHING, COMPRESSION AND REFLECTING
Now let's consider the stretching and reflecting transformations. If c > 1 then the graph of y = cf(x) is the graph of y = f(x) stretched by a factor of c in the vertical direction (because each y‒coordinate multiplied by the same number c). The graph of y = f(x) is the graph of y = f(x) reflected about the x‒axis because the point (x, y) is replaced by the point (x,y) (the following chart, where the results of other stretching, compressing, and reflecting transformations are also given.)
VERTICAL AND HORIZONTAL STRETCHING AND COMPRESSION
To obtain the graph of
• y = cf(x) stretch the graph of y = f(x) vertically by a factor of c
• y = 1/c f(x) compress the graph of y = f(x) vertically by a factor of c
• y = f(cx) compress the graph of y = f(x) horizontally by a factor of c
• y = f(x/c) stretch the graph of y = f(x) horizontally by a factor of c

REFLECTION
• y = −f(x) reflect the graph of y = f(x) about the x‒axis
• y = ƒ(− x) reflect the graph of y = f(x) about the y‒axis

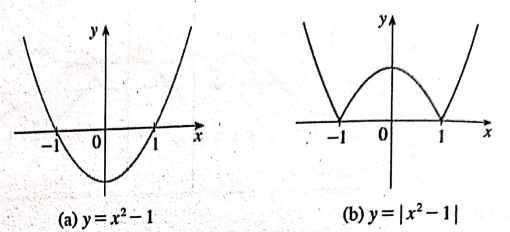
Example 27. Sketch the graph of the function y = | x2 ‒ 1 |.
Solution: y = x2‒1 1 is a parabola with symmetrical about y‒axis with vertex (1,0). i.e., by shifting the parabola y = x2 downward 1 unit. When −1 < x < 1, y = x2 ‒ 1 is negative. We see that the graph lies below the x‒axis when ‒1 < x < 1. So we reflect that part of the graph about the x‒axis to obtain the graph of y = |x2 ‒ 1|.
Example 28. Sketch the graph of (a) y=√(x‒3) (b) y = √(x+3)
Solution:
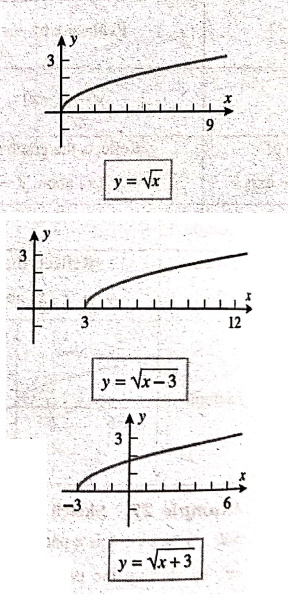
a) Using the translation principles given, the graph of the equation y = √(x‒3) can be obtained by translating the graph of y = √x right 3 units.
b) The graph of y = √(x+3) can be obtained by translating the graph of y = √x left 3 units.
Example 29. Sketch the graph of y = x2 ‒ 4x + 5.
Solution: Completing the square on the first two terms yields
y = (x2 ‒ 4x + 4) ‒ 4 + 5 = (x‒2)2 + 1
In this form we see that the graph can be obtained by translating the graph of y = x2 right 2 units because of the x‒2, and up 1 unit because of the +1.

Example 30. Given the graph of y = √x, use transformations to graph y = √x‒2. y = √(x‒2), y = ‒√x, y = 2√x, and y = √(‒x).
Solution:
Given y = √x. i.e., y2 = x is a parabola passing through origin symmetrical about x‒axis. In the other parts of the figure we sketch y=√x‒2 shifting 2 units downward, y = √(x ‒ 2) by shifting 2 units to the right, y = ‒√x by reflecting about the x‒axis, y = 2√x by stretching vertically by a factor of 2, and y = √‒x reflecting about the y‒axis.

Example 31. Sketch the graph of y = 3√(2‒x).
Solution: Using the translation and reflection principles, we can obtain the graph by a reflection followed by a translation as follows: First reflect the graph of y = 3√x about the y‒axis to obtain the graph of y = 3√‒x, then translate this graph right 2 units to obtain the graph of the equation y = 3√[‒(x‒2)] = 3√[2‒x]

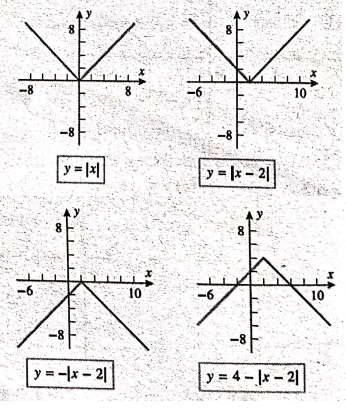
Example 32. Sketch the graph of y = 4 ‒ | x ‒ 2|.
Solution: The graph can be obtained by a reflection and two translations: First translate the graph of y = |x| right 2 units to obtain the graph of y = |x ‒ 2|; then reflect this graph about the x‒axis to obtain the graph of y = ‒|x‒2|; and then translate this graph up 4 units to obtain the graph of the equation y = ‒ |x − 2| + 4 = 4 ‒ |x ‒ 2|.
Example 33. Sketch the graphs of the following functions.
(a) y = cos 2x
(b) y = cos (1/2)x
Solution: (a) We obtain the graph of y = cos 2x from that of y = cos x by compressing horizontally by a factor of 2. Thus, whereas the period of y = cos x is 2π, the period of y = cos 2x is 2π/2 = π.
(b) We obtain the graph of y = cos ½ x from that of y = cos x by stretching horizontally by a factor of 2. Thus, whereas the period of y = cos x is 2π, the period of y = = cos ½ x is 2π × 2 = 4π.

Example 34. Sketch the graphs of the following functions.
(a) y = 2cos x
(b) y = 1/2 cos x
Solution: (a) We obtain the graph of y = 2 cosx from that of y = cos x by stretched vertically by a factor of 2. Thus, whereas the period of y = cos x is 2π, the period of y= 2 cos x is also 2π.
(b) We obtain the graph of y = 1/2 cosx from that of y = cos x by compress vertically by a factor of 2. Thus, whereas the period of y = cos x is 2π, the period of y = ½ cosx is also 2π.

Example 35. Sketch the graphs of the following functions.
(a) y = sin 2x
(b) y = 1 ‒ sin x
(a) We obtain the graph of y = sin 2x from that of y = sin x by compressing horizontally by a factor of 2. Thus, whereas the period of y = sin x is 2π, the
period of y = sin 2x is 2π/2 = π.

(b) To obtain the graph of y = 1‒ sin x, we again start with y sin x. We reflect about the x‒axis to get the graph of y = ‒ sin x and then we shift 1 unit upward to get y = 1‒ sin x.

EXERCISE
9. Suppose the graph of ƒ is given. Write equations for the graphs that are obtained
from the graph of ƒ as follows.
(a) Shift 3 units upward.
(b) Shift 3 units downward.
(c) Shift 3 units to the right.
(d) Shift 3 units to the left.
(e) Reflect about the x‒axis.
(f) Reflect about the y‒axis.
(g) Stretch vertically by a factor of 3.
(h) Shrink vertically by a factor of 3.
10. Explain how each graph is obtained from the graph of y = f(x).
(a) y = 5f(x)
(b) y = f(x‒5)
(c) y = ‒f(x)
(d) y = ‒5f(x)
(e) y = f(5x)
(f) y = 5f(x) ‒3
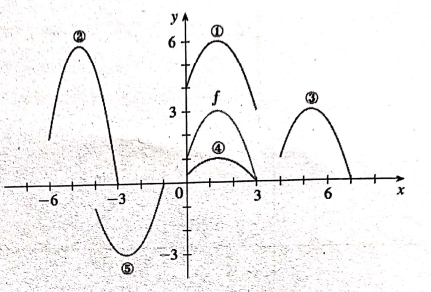
11. The graph of y = f(x) is given. Match each equation with its graph and give
reasons for your choices.
(a) y = f(x‒4)
(b) y = f(x)+3
(c) y = 1/3 f(x)
(d) y = − f(x+4)
(e) y = 2f(x+6)
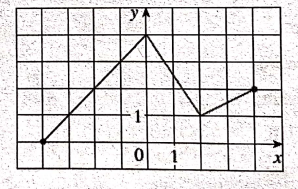
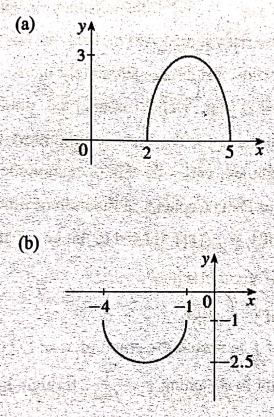
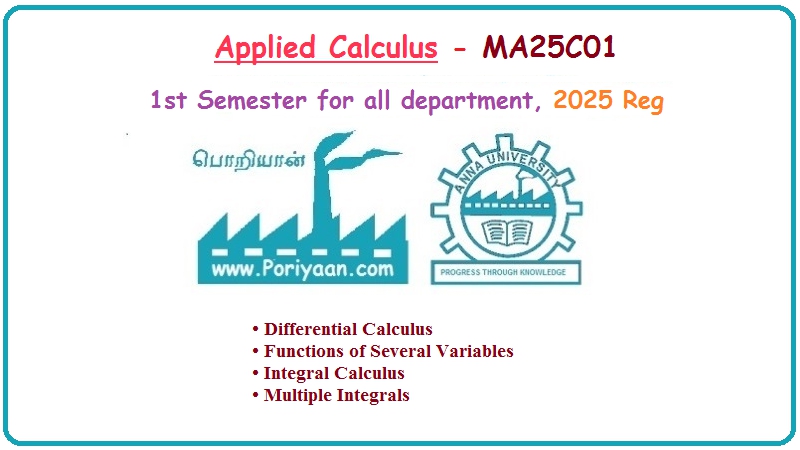
12. The graph of ƒ is given. Draw the graphs of the following functions.
(a) y = f(x+4)
(b) y = f(x) + 4
(c) y = 2f(x)
(d) y = − (½)f(x) + 3
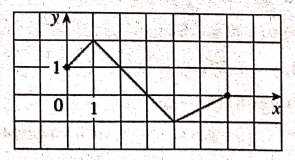
13. The graph of ƒ is given. Use it to graph the following functions.
(a) y = f(2x)
(b) y = f( 1/2 x)
(c) y = f(‒x)
(d) y = ‒f(‒x)
14. The graph of y = √[3x‒x2] is given.
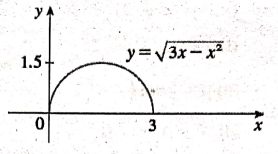
Use transformations to create a function whose graph is as shown.
15. (a) How is the graph of y = 2 sin x related to the graph of y = sinx? Sketch the graph y = 2 sin x.
(b) How is the graph of y = 1+ √x related to the graph of y = √x? Sketch the graph of y = 1 + √x.
16. Graph the function by hand, not by plotting points, but by starting with the graph of one of the standard functions given in Section 2, and then applying the appropriate transformations.
(a) y = ‒x3
(b) y = 1‒x2
(c) y = (x + 1)2
(d) y = x2 ‒ 4x + 3
(e) y = 1 + 2cos x
(f) y = 4sin3x
(g) y = sin(x/2)
(h) y = 1 / x‒4
(i) y = √[x +3]
(j) y = (x + 2)4 + 3
(k) y = ½ (x2 + 8x)
(l) y = 1 + 3√(x – 1)
(m) y = 2 / x+1
(n) y = ¼ tan (x − π/4)
(o) y = |sinx|
(p) y = |x2 ‒ 2x|
17. The city of New Orleans is located at latitude 30°N. Use Figure 9 to find a function that models the number of hours of daylight at New Orleans as a function of the time of year. To check the accuracy of your model, use the fact that on March 31 the sun rises at 5:51 AM and sets at 6:18 PM in New Orleans.
18. A variable star is one whose brightness alternately increases and decreases. For the most visible variable star, Delta Cephei, the time between periods of maximum brightness is 54 days. the average brightness (or magnitude) of the star is 4.0, and its brightness varies by ±0.35 magnitude. Find a function that models the brightness of Delta Cephei as a function of time.
19. (a) How is the graph of y = f(|x|) related to the graph of f?
(b) Sketch the graph of y = sin |x|.
(c) Sketch the graph of y = √|x|.
20. Use the given graph of ƒ to sketch the graph of y = 1/f(x). Which features of f are the most important in sketching y = 1/ f(x) ? Explain how they are used.
Applied Calculus: UNIT I: Differential Calculus : Tag: Applied Calculus : New functions from old function | Differential Calculus - Transformations of functions
Applied Calculus: UNIT I: Differential Calculus
Under Subject
Applied Calculus
MA25C01 Maths 1 M1 - 1st Semester | 2025 Regulation | 1st Semester 2025 Regulation
Related Subjects

English Essentials I
EN25C01 1st Semester | 2025 Regulation | 1st Semester 2025 Regulation

தமிழர் மரபு - Heritage of Tamils
UC25H01 1st Semester | 2025 Regulation | 1st Semester 2025 Regulation
Applied Calculus
MA25C01 Maths 1 M1 - 1st Semester | 2025 Regulation | 1st Semester 2025 Regulation
Applied Physics I
PH25C01 1st Semester | 2025 Regulation | 1st Semester 2025 Regulation

Applied Chemistry I
CY25C01 1st Semester | 2025 Regulation | 1st Semester 2025 Regulation

Makerspace
ME25C04 1st Semester | 2025 Regulation | 1st Semester 2025 Regulation
Computer Programming C
CS25C01 1st Semester | 2025 Regulation | 1st Semester 2025 Regulation

Computer Programming Python
CS25C02 1st Semester | 2025 Regulation | 1st Semester 2025 Regulation

Fundamentals of Electrical and Electronics Engineering
EE25C03 1st Semester | 2025 Regulation | 1st Semester 2025 Regulation

Introduction to Mechanical Engineering
ME25C03 1st Semester | 2025 Regulation | 1st Semester 2025 Regulation

Introduction to Civil Engineering
CE25C01 1st Semester Civil Department | 2025 Regulation | 1st Semester 2025 Regulation
Essentials of Computing
CS25C03 1st Semester - AID CSE IT Department | 2025 Regulation | 1st Semester 2025 Regulation

Applied Physics I Laboratory
PH25C01 1st Semester practical Laboratory Manual | 2025 Regulation | 1st Semester Laboratory 2025 Regulation

Applied Chemistry I Laboratory
CY25C01 1st Semester practical Laboratory Manual | 2025 Regulation | 1st Semester Laboratory 2025 Regulation

Computer Programming C Laboratory
CS25C01 1st Semester practical Laboratory Manual | 2025 Regulation | 1st Semester Laboratory 2025 Regulation

Computer Programming Python Laboratory
CS25C02 1st Semester practical Laboratory Manual | 2025 Regulation | 1st Semester Laboratory 2025 Regulation
Engineering Drawing
ME25C01 EEE Mech Dept | 2025 Regulation | 2nd Semester 2025 Regulation

Basic Electronics and Electrical Engineering
EE25C04 1st Semester ECE Dept | 2025 Regulation | 2nd Semester 2025 Regulation