Python for Data Science: Chapter 6: Data Visualization
Matplotlib: Adding Text and Annotation
Python open source drawing library
By adding text and annotations to the graph, we can make it more informative.
Adding
Text and Annotation
•
By adding text and annotations to the
graph, we can make it more informative.
•
Let us discuss them one by one ‒
1) Adding Text
•
We can add text to any desired location in the graph.
•
The plt.text(x, y, "text")
function adds text at a specific location.
Demo example
import matplotlib.pyplot as plt
x = [1, 2, 3, 4, 5]
y = [10, 15, 20, 25, 30]
plt.plot(x, y,marker='0')
# Add
text
plt.text(3,
20, "Mid Point", fontsize=14, color='black')
plt.show()
Output
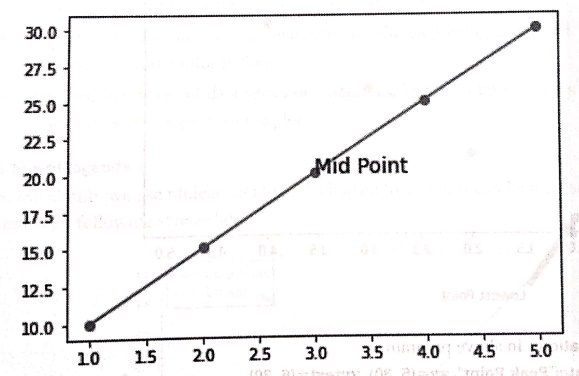
•
In above program we have the text "Mid
Point" is placed at (x=3, y=20). The fontsize=12 sets the text size.
2) Adding annotations
•
The annotate() function adds an
annotation with optional arrows pointing to specific points on the graph.
Demo example
import matplotlib.pyplot as plt
x = [1, 2, 3, 4, 5]
y = [10, 15, 20, 25, 30]
# Scatter plot
plt.scatter(x, y, color='green')
#
Annotate the highest point
plt.annotate("Peak
Point", xy=(5, 30), xytext=(6, 30),
arrowprops=dict(arrowstyle="‒>"),
fontsize=12)
#
Annotate the lowest point
plt.annotate("Lowest
Point", xy=(1, 10), xytext=(1.5, 4),
arrowprops=dict(facecolor='blue',
shrink=0.02))
plt.show()
Output
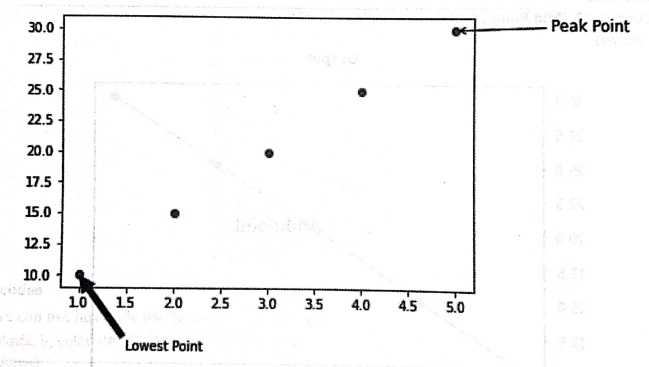
Code explanation:
In above program,
1) plt.annotate("Peak Point", xy=(5,
30), xytext=(6, 30),
arrowprops=dict(arrowstyle="‒>"),
fontsize=12)
•
This line annotates the highest point (5, 30) with the label "Peak
Point".
•
The annotate() function is used for
this purpose.
•
The xy parameter specifies the the coordinates of the point being annotated,
ted, and xytext specifies the
location of the annotation text.
•
The arrowprops parameter defines the
properties of the arrow and fontsize
sets the font size of the annotation text.
2) plt.annotate("Lowest
Point", xy=(1, 10), xytext=(1.5, 4),
arrowprops= dict(facecolor='blue',
shrink=0.02))
•
This line annotates the lowest point (1, 10) with the label "Lowest
Point".
•
Similar to the previous annotation, xy
specifies the point being annotated and
xytext specifies the location of the text.
•
The arrowprops parameter defines the properties of the arrow, including facecolor which sets the arrow color to
blue, and shrink which slightly
shrinks the arrow from the text to the point.
Python for Data Science: Chapter 6: Data Visualization : Tag: Computer Programming, Python, Data Science : Python open source drawing library - Matplotlib: Adding Text and Annotation
Python for Data Science: Chapter 6: Data Visualization
Under Subject

Python for Data Science
AD25201 2nd Semester AIDS Dept | 2025 Regulation | 2nd Semester 2025 Regulation
Related Subjects

English Essentials II
EN25C02 2nd Semester | 2025 Regulation | 2nd Semester 2025 Regulation

Tamils and Technology தமிழர்களும் தொழில்நுட்பமும்
UC25H02 2nd Semester | 2025 Regulation | 2nd Semester 2025 Regulation

Linear Algebra
MA25C02 2nd Semester | 2025 Regulation

Applied Physics (CSIE) II
PH25C03 2nd Semester AIDS, CSE, IT, CSE(CY) Dept | 2025 Regulation | 2nd Semester 2025 Regulation

Digital Principles and Computer Organization
CS25C06 2nd Semester AIDS, CSE, IT, CSE(CY) Dept | 2025 Regulation | 2nd Semester 2025 Regulation

Basic Electrical and Electronics Engineering
EE25C01 2nd Semester | 2025 Regulation | 2nd Semester 2025 Regulation
Python for Data Science
AD25201 2nd Semester AIDS Dept | 2025 Regulation | 2nd Semester 2025 Regulation

Re-Engineering for Innovation
ME25C05 2nd Semester | 2025 Regulation | 2nd Semester 2025 Regulation

Python for Data Science - Laboratory
AD25201 2nd Semester AIDS Dept | 2025 Regulation | 2nd Semester 2025 Regulation