Python for Data Science: Chapter 6: Data Visualization
Matplotlib: Colors
Python open source drawing library
For giving different color to the plot, we use the attribute color.
Colors
•
For giving different color to the plot,
we use the attribute color. For example –
Python code
from matplotlib import pyplot as plt
import numpy as np
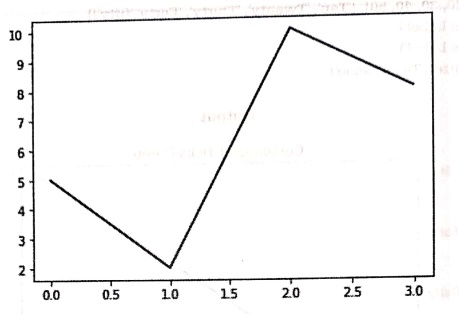
y = np.array([5,2,10,8])
plt.plot(y,color = 'b')
plt.show()
Output
•
The shortcuts for different colors are enlisted as below ‒
'r'
Red
'g' Green
'b' Blue
'c' Cyan
'm' Magenta
'y' Yellow
'k' Black
'w' White
Hex codes
•
We can use hex code for the colors. For example –
plt.plot(x,
y, color='#ff5733') # Orange‒red color
plt.show()
RGB Tuples
•
We can specify colors using RGB tuples (R, G, B) or RGBA (R, G, B, A), where A
is the transparency (alpha value). For example ‒
plt.plot(x,
y, color=(0.2, 0.6, 0.8)) # RGB values (normalized between 0 and 1)
plt.show()
Python for Data Science: Chapter 6: Data Visualization : Tag: Computer Programming, Python, Data Science : Python open source drawing library - Matplotlib: Colors
Python for Data Science: Chapter 6: Data Visualization
Under Subject

Python for Data Science
AD25201 2nd Semester AIDS Dept | 2025 Regulation | 2nd Semester 2025 Regulation
Related Subjects

English Essentials II
EN25C02 2nd Semester | 2025 Regulation | 2nd Semester 2025 Regulation

Tamils and Technology தமிழர்களும் தொழில்நுட்பமும்
UC25H02 2nd Semester | 2025 Regulation | 2nd Semester 2025 Regulation

Linear Algebra
MA25C02 2nd Semester | 2025 Regulation

Applied Physics (CSIE) II
PH25C03 2nd Semester AIDS, CSE, IT, CSE(CY) Dept | 2025 Regulation | 2nd Semester 2025 Regulation

Digital Principles and Computer Organization
CS25C06 2nd Semester AIDS, CSE, IT, CSE(CY) Dept | 2025 Regulation | 2nd Semester 2025 Regulation

Basic Electrical and Electronics Engineering
EE25C01 2nd Semester | 2025 Regulation | 2nd Semester 2025 Regulation
Python for Data Science
AD25201 2nd Semester AIDS Dept | 2025 Regulation | 2nd Semester 2025 Regulation

Re-Engineering for Innovation
ME25C05 2nd Semester | 2025 Regulation | 2nd Semester 2025 Regulation

Python for Data Science - Laboratory
AD25201 2nd Semester AIDS Dept | 2025 Regulation | 2nd Semester 2025 Regulation