Python for Data Science: Chapter 6: Data Visualization
Seaborn Library
Python open source drawing library
Seaborn is a Python data visualization library based on matplotlib. It provides a high‒level interface for drawing attractive and informative statistical graphics.
Seaborn
Library
•
Seaborn is a Python data visualization library based on matplotlib. It provides
a high‒level interface for drawing attractive
and informative statistical graphics.
•
Seaborn is built on top of matplotlib
and integrates closely with Pandas
data structures.
•
Seaborn is particularly well suited for working with complex data sets.
Features of Seaborn
1) Data set oriented
functionalities: Seaborn's functions are designed to
work directly with datasets, making it easy to visualize relationships between
variables without extensive data manipulation.
2) Statistical estimation and
inference: It can automatically compute and display busque
summary statistics into its plots, making it easy to visualize relationship
among the data items.
3) Integration with Pandas
DataFrames: Seaborn seamlessly integrates with
Pandas DataFrames, allowing users to work directly with their data structures.
This makes it convenient to visualize and analyze data stored in DataFrames.
4) Categorical plotting :
Seaborn provides specialized functions for visualizing categorical data, making
it easy to create plots that show the distribution of categories or compare
different categories.
5) Theme and style options:
Seaborn provides built‒in themes and styles to quickly change the overall look
and feel of your plots.
6) Customizable aesthetics:
Seaborn offers extensive control over plot aesthetics, such geres as colors,
styles and markers, allowing you to create visually appealing and Toy to
informative plots.
7) Multi‒plot grids:
Seaborn makes it easy to create grids of plots for comparing multiple variables
or groups.
Difference between Matplotlib and Seaborn
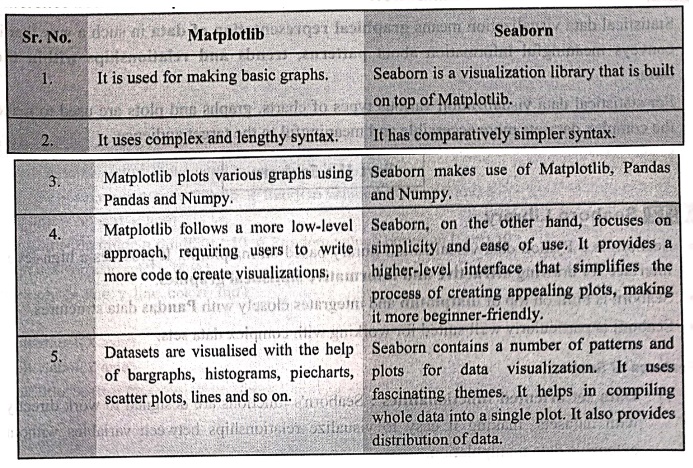
Matplotlib
1.It
is used for making basic graphs.
2.It
uses complex and lengthy syntax.
3.Matplotlib
plots various graphs using Pandas and Numpy.
4.Matplotlib
follows a more low‒level approach, requiring users to write more code to create
visualizations.
5.Datasets
are visualised with the help of bargraphs, histograms, piecharts, scatter
plots, lines and so on.
Seaborn
1.Seaborn
is a visualization library that is built on top of Matplotlib.
2.It
has comparatively simpler syntax.
3.Seaborn
makes use of Matplotlib, Pandas and Numpy.
4.Seaborn,
on the other hand, focuses on simplicity and ease of use. It provides a higher‒level
interface that simplifies the process of creating appealing plots, making it
more beginner‒friendly.
5.Seaborn
contains a number of patterns and plots for data visualization. It uses
fascinating themes. It helps in compiling whole data into a single plot. It
also provides distribution of data.
Installation
•
Before installing the Seaborn, it is
necessary to install Python and pip. Using Command prompt we can issue
following command to install seaborn
pip
install seaborn
•
Anaconda is a free Distribution package
for Python. If you have already installed Anaconda on your PC, then the seaborn
package comes by default with this distribution and then there is no need to
install it.
Dependencies
•
Following are the dependencies of Python seaborn packages
■
Python 3.4+
■
numpy
■
scipy
■
matplotlib
■
pandas
Import
•
For importing the seaborn library following code must be written at the
beginning of your Python code
import
seaborn as sns
Python for Data Science: Chapter 6: Data Visualization : Tag: Computer Programming, Python, Data Science : Python open source drawing library - Seaborn Library
Python for Data Science: Chapter 6: Data Visualization
Under Subject

Python for Data Science
AD25201 2nd Semester AIDS Dept | 2025 Regulation | 2nd Semester 2025 Regulation
Related Subjects

English Essentials II
EN25C02 2nd Semester | 2025 Regulation | 2nd Semester 2025 Regulation

Tamils and Technology தமிழர்களும் தொழில்நுட்பமும்
UC25H02 2nd Semester | 2025 Regulation | 2nd Semester 2025 Regulation

Linear Algebra
MA25C02 2nd Semester | 2025 Regulation

Applied Physics (CSIE) II
PH25C03 2nd Semester AIDS, CSE, IT, CSE(CY) Dept | 2025 Regulation | 2nd Semester 2025 Regulation

Digital Principles and Computer Organization
CS25C06 2nd Semester AIDS, CSE, IT, CSE(CY) Dept | 2025 Regulation | 2nd Semester 2025 Regulation

Basic Electrical and Electronics Engineering
EE25C01 2nd Semester | 2025 Regulation | 2nd Semester 2025 Regulation
Python for Data Science
AD25201 2nd Semester AIDS Dept | 2025 Regulation | 2nd Semester 2025 Regulation

Re-Engineering for Innovation
ME25C05 2nd Semester | 2025 Regulation | 2nd Semester 2025 Regulation

Python for Data Science - Laboratory
AD25201 2nd Semester AIDS Dept | 2025 Regulation | 2nd Semester 2025 Regulation