Python for Data Science: Chapter 6: Data Visualization
Matplotlib: Making Subplots
Python open source drawing library
In real world we often need to compare multiple graphs side by side, for example Temperature Vs. Humidity. 1) The subplot() function 2) The subplots() function
Making
Subplots
•
In real world we often need to compare multiple graphs side by side, for
example Temperature Vs. Humidity, Sales Vs. Profit then subplots allow us to create multiple plots in single figure window.
1) The subplot() function
Syntax
plt.subplot(nrows,ncols,index)
Where
nrows:
Number of rows in subplot grid
ncols:
Number of columns in the subplot grid
index:
Position of current plot(counted left to right and top to bottom)
Python program
import matplotlib.pyplot as plt
x=(1,2,3,4,5]
y1=[2,4,6,8,10]
y2=[1,4,9,16,25]
plt.subplot(1,2,1)
plt.plot(x,y1,'r‒‒')
plt.title("plot#1")
plt.subplot(1,2,2)
plt.plot(x,y2,'b‒.')
plt.title("plot #2")
plt.suptitle("Main Plot")
plt.show()
Output
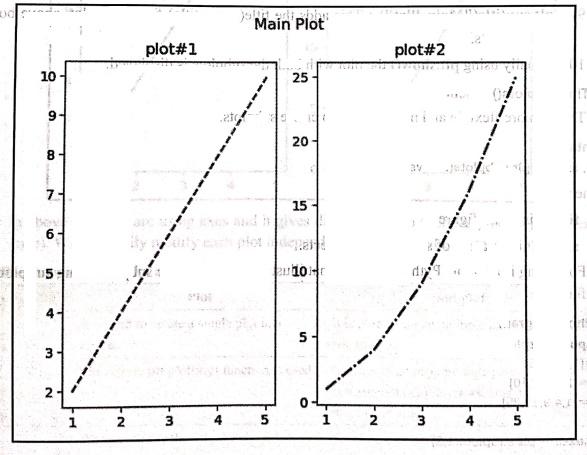
Code explanation:
In above code,
1)
We have imported the library file
Matplotlib.
2)
We have with us common x axis co‒ordinates and y1 and y2 arrays for y axis co‒ordinates.
3) plt.subplot(1, 2, 1): Creates a subplot
grid with row 1 and two columns and activates first subplot.
4)
plt.plot(x, y1, 'r‒‒'): It plots yl
Vs x in the first subplot. The 'r‒‒' means red dashed line.
5)
plt.title("plot#1"): Sets
the title of the first subplot.
6)
plt.subplot(1, 2, 2): Activates the
second subplot in the same 1*2 grid.
7)
plt.plot(x, y2, 'b‒.'): It plots y2
vs x in the second subplot. The 'b‒.' means blue dash (lol reM)eluque lig dot
line.
8) plt.title("plot#2"): Sets
the title of the second subplot.
9)
plt.suptitle("Main Plot"):
This adds the title(super title) for entire plot, above both the subplots.
10)
Finally using plt.show() the plot
with both the subplots is displayed.
2) The subplots() function
•
This is more flexible and modern way to create subplots.
syntax
fig, axes =
plt.subplots(nrows, ncols)
Where
fig:
It is entire figure
axes:
It is an array of subplot axes objects.
•
Following is a simple Python program
that illustrates how to have subplots using subplots() function.
Python program
import matplotlib.pyplot
as plt
x=(1,2,3,4,5]
y1=[2,4,6,8,10]
y2=[1,4,9,16,25]
fig,axes = plt.subplots(1,2)
axes[0].plot(x,y1,color = 'red')
axes[0].set_title("plot#1")
axes[1].plot(x,y2,color = 'blue')
axes[1].set_title("plot#2")
plt.suptitle("Main Plot")
plt.show()
Output
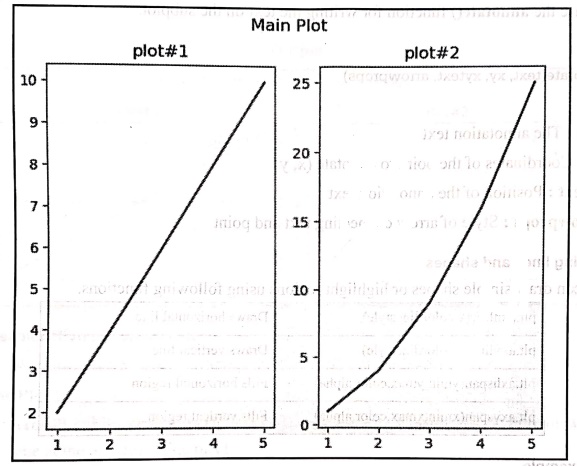
•
In above code we are using axes and it
gives direct access to each subplot (object‒oriented style). We can easily
modify each plot independently (titles, labels, colors, etc.)
Difference
between Plot and Subplot.
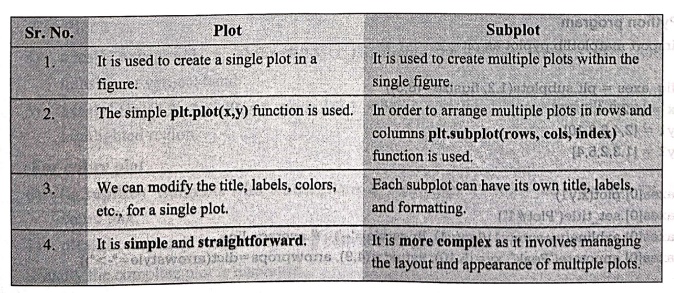
Plot
1.It
is used to create a single plot in a figure.
2.The
simple plt.plot(x,y) function is
used.
3.We
can modify the title, labels, colors, etc., for a single plot.
4.It
is simple and straightforward.
Subplot
1.It
is used to create multiple plots within the single figure.
2.In
order to arrange multiple plots in rows and columns plt.subplot(rows, cols, index)
function is used.
3.Each
subplot can have its own title, labels, and formatting.
4.It
is more complex as it involves
managing agongwans ( the layout and appearance of multiple plots.
Python for Data Science: Chapter 6: Data Visualization : Tag: Computer Programming, Python, Data Science : Python open source drawing library - Matplotlib: Making Subplots
Python for Data Science: Chapter 6: Data Visualization
Under Subject

Python for Data Science
AD25201 2nd Semester AIDS Dept | 2025 Regulation | 2nd Semester 2025 Regulation
Related Subjects

English Essentials II
EN25C02 2nd Semester | 2025 Regulation | 2nd Semester 2025 Regulation

Tamils and Technology தமிழர்களும் தொழில்நுட்பமும்
UC25H02 2nd Semester | 2025 Regulation | 2nd Semester 2025 Regulation

Linear Algebra
MA25C02 2nd Semester | 2025 Regulation

Applied Physics (CSIE) II
PH25C03 2nd Semester AIDS, CSE, IT, CSE(CY) Dept | 2025 Regulation | 2nd Semester 2025 Regulation

Digital Principles and Computer Organization
CS25C06 2nd Semester AIDS, CSE, IT, CSE(CY) Dept | 2025 Regulation | 2nd Semester 2025 Regulation

Basic Electrical and Electronics Engineering
EE25C01 2nd Semester | 2025 Regulation | 2nd Semester 2025 Regulation
Python for Data Science
AD25201 2nd Semester AIDS Dept | 2025 Regulation | 2nd Semester 2025 Regulation

Re-Engineering for Innovation
ME25C05 2nd Semester | 2025 Regulation | 2nd Semester 2025 Regulation

Python for Data Science - Laboratory
AD25201 2nd Semester AIDS Dept | 2025 Regulation | 2nd Semester 2025 Regulation